Comparative Study
. 2010 Dec 21:8:149.
doi: 10.1186/1741-7007-8-149.

The majority of total nuclear-encoded non-ribosomal RNA in a human cell is 'dark matter' un-annotated RNA

Affiliations
Comparative Study

The majority of total nuclear-encoded non-ribosomal RNA in a human cell is 'dark matter' un-annotated RNA

Philipp Kapranov et al. BMC Biol. .

Erratum in

  • BMC Biol. 2011;9:86

Abstract

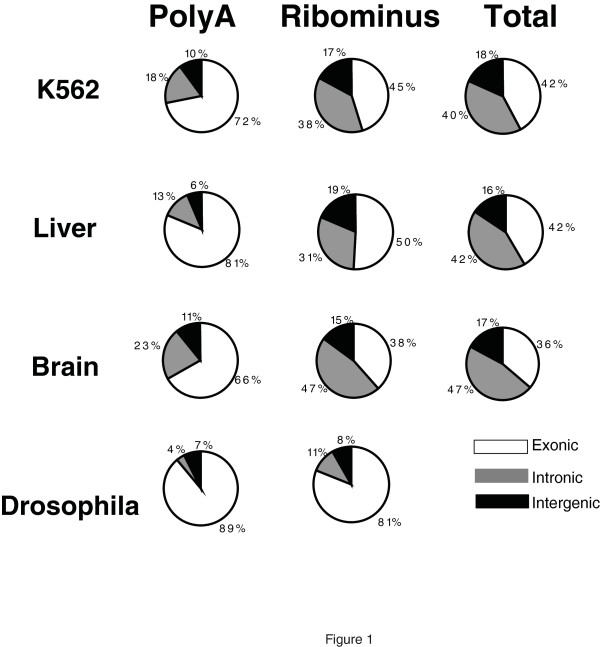
Background: Discovery that the transcriptional output of the human genome is far more complex than predicted by the current set of protein-coding annotations and that most RNAs produced do not appear to encode proteins has transformed our understanding of genome complexity and suggests new paradigms of genome regulation. However, the fraction of all cellular RNA whose function we do not understand and the fraction of the genome that is utilized to produce that RNA remain controversial. This is not simply a bookkeeping issue because the degree to which this un-annotated transcription is present has important implications with respect to its biologic function and to the general architecture of genome regulation. For example, efforts to elucidate how non-coding RNAs (ncRNAs) regulate genome function will be compromised if that class of RNAs is dismissed as simply 'transcriptional noise'.

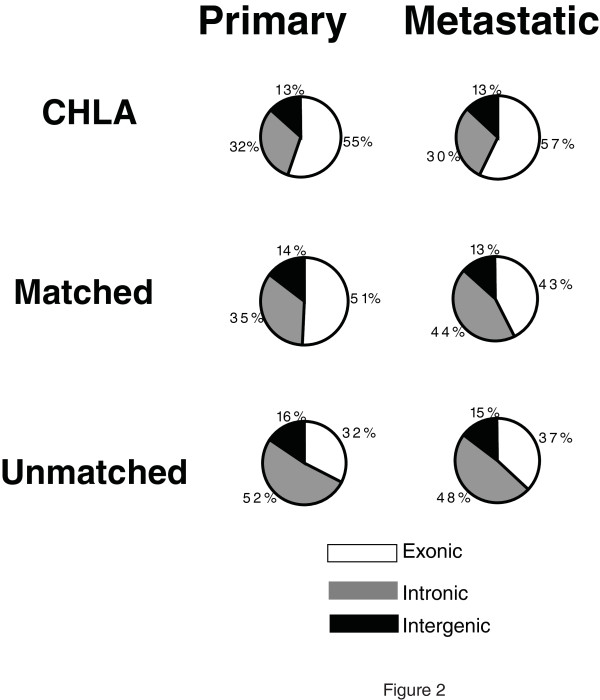
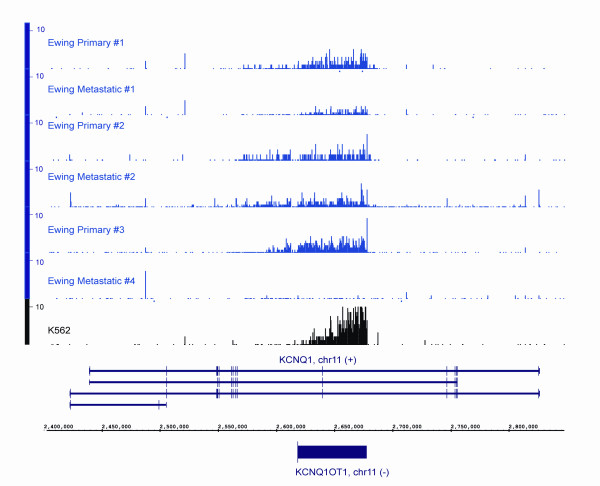
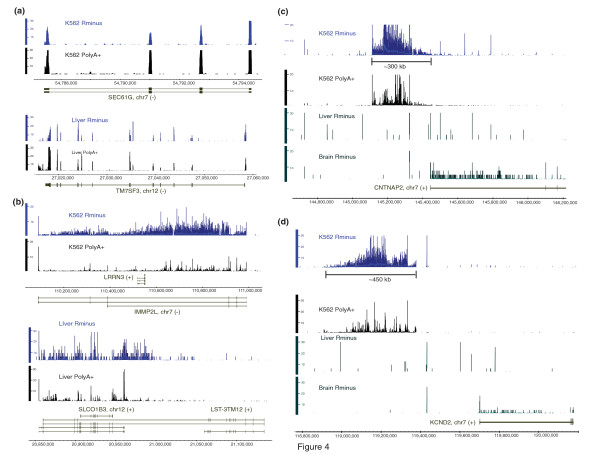
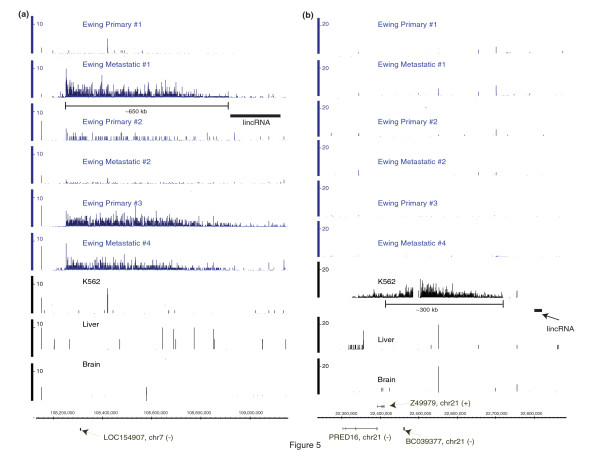
Results: We show that the relative mass of RNA whose function and/or structure we do not understand (the so called 'dark matter' RNAs), as a proportion of all non-ribosomal, non-mitochondrial human RNA (mt-RNA), can be greater than that of protein-encoding transcripts. This observation is obscured in studies that focus only on polyA-selected RNA, a method that enriches for protein coding RNAs and at the same time discards the vast majority of RNA prior to analysis. We further show the presence of a large number of very long, abundantly-transcribed regions (100's of kb) in intergenic space and further show that expression of these regions is associated with neoplastic transformation. These overlap some regions found previously in normal human embryonic tissues and raises an interesting hypothesis as to the function of these ncRNAs in both early development and neoplastic transformation.

Conclusions: We conclude that 'dark matter' RNA can constitute the majority of non-ribosomal, non-mitochondrial-RNA and a significant fraction arises from numerous very long, intergenic transcribed regions that could be involved in neoplastic transformation.


Figures

Figure 1
Figure 1
Distribution of single-molecule sequencing (SMS) reads among exonic, intronic and intergenic regions in polyA+, RiboMinus and total RNA. RNA samples were prepared as described in the Materals and Methods section of the paper for sequencing. Each source of RNA [K562 cells, human liver or brain tissue and adult flies (Drosophila)] was used either directly (total RNA) or after fractionation by RiboMinus treatment or selection for the polyA containing RNAs. Each sample was sequenced on one or more channels. Reads were aligned to hg18 or dm3 version of the human or fly genomes. After the removal of reads that aligned to the mitochondrial and ribosomal sequences, the remaining sequences were assigned as exonic (white), intronic (grey) or intergenic (black) based on the University of California Santa Cruz genes database and the percentages found for each are shown as pie charts. The exact read data can be found in Additional File 2: Table S1.
Figure 2
Figure 2
Distribution of single-molecule sequencing (SMS) reads among exonic, intronic and intergenic regions in RiboMinus RNA of different Ewing Family of Tumours samples. RNA samples were prepared as described in the Materials and Methods section of the paper for sequencing. Each source of RNA (from immortalized cell lines (CHLA), from primary and metastatic tumours, from primary and metastatic tumours from one individual (matched) and from primary and metastatic tumours from different individuals (unmatched), was used after the removal of most of the ribosomal RNA by RiboMinus treatment. Each sample was sequenced on one or more channels. Reads were aligned to the hg18 or dm3 version of the human or fly genomes. After removal of reads that aligned to mitochondrial and ribosomal sequences, the remaining sequences were assigned as exonic (white), intronic (grey) or intergenic (black) based on the University of California Santa Cruz genes database and the percentages found for each are shown as pie charts. The exact read data can be found in Additional File 3: Table S2
Figure 3
Figure 3
Detection of a known intronic non-coding RNA (ncRNA) KCNQOT1 in RiboMinus RNAs from Ewing Family of Tumours (EFT) and K562 tumour samples. Gene expression arising from chromosome 11, positions 2,400,000 to 2,800,000 (near the KCNQ1 gene) is shown for seven different RNA samples, six EFT samples and the K562 cell line. For each sample, the Y axis (0-10) shows the density of reads per genomic base overlapped by at least one read in 10 million non-ribosomal, non-mitochondrial reads with the X-axis showing the chromosomal position. The location of annotated exons on the sense strand (+) for KCNQ1 is shown between the chromosomal position and the expression levels for each sample. The position of the antisense (-) intronic ncRNA KCNQ1OT1 is shown below the chromosomal position. All gene annotations and genomic coordinates are based on University of California Santa Cruz genes and hg18 version of the genome.
Figure 4
Figure 4
The presence of abundant non-exonic RNAs in introns and intergenic regions in human cells. Chromosomal locations and gene regions that display different patterns of intronic or intergenic expression are shown in panels A-D. For each region, the chromosome, annotated gene and strand are shown at the bottom with annotated exons represented by boxes. Above the exons, chromosomal positions based on the University of California Santa Cruz genes and the hg18 version of the genome are shown. The source of the sample RNA (K562, liver or brain) and the type of RNA preparation (RiboMinus or polyA selected) are shown next to the Y-axis. Examples of loci producing little or large amounts of intronic RNAs are shown in panels A and B. Examples of very long intergenic transcribed regions are shown in panels C and D. The Y axis show the density of reads per each genomic base overlapped by at least one read in reads per 10 million of non-ribosomal, non-mitochondrial reads.
Figure 5
Figure 5
An example of very long transcribed intergenic regions identified in tumour cells. An example of a locus with high expression between annotated genes on chromosome 7 that was found in several Ewing Family of Tumours (EFT) cell lines and tissues but not in K562 or normal tissues is shown in panel A with chromosomal position along the X axis. A locus on chromosome 21 that was found to have high expression in K562 but not EFT samples or normal tissues is shown in panel B. The EFT primary No,1 and metastatic No.1 samples correspond to the CHLA-9 and CHLA-10 cell lines (see the Materials and Methods Section of the paper) and the remainder are from patient EFT samples, K562 cells, or normal tissues (liver and brain). The K4-K36 domains which harbour large intergenic non-coding RNAs, as reported by Khalil et al. [27], are also shown. The Y axis show the density of reads per each genomic base in 10 million non-ribosomal, non-mitochondrial reads. The chromosome (chr) of origin and strand of a transcript (+) or (-) are indicated.

Similar articles

Cited by

References

    1. Bertone P, Stolc V, Royce TE, Rozowsky JS, Urban AE, Zhu X, Rinn JL, Tongprasit W, Samanta M, Weissman S. et al.Global identification of human transcribed sequences with genome tiling arrays. Science. 2004;306(5705):2242–2246. doi: 10.1126/science.1103388. - DOI - PubMed
    1. Cheng J, Kapranov P, Drenkow J, Dike S, Brubaker S, Patel S, Long J, Stern D, Tammana H, Helt G, Sementchenko V. et al.Transcriptional maps of 10 human chromosomes at 5-nucleotide resolution. Science. 2005;308(5725):1149–1154. doi: 10.1126/science.1108625. - DOI - PubMed
    1. Kapranov P, Cheng J, Dike S, Nix DA, Duttagupta R, Willingham AT, Stadler PF, Hertel J, Hackermuller J, Hofacker IL. et al.RNA maps reveal new RNA classes and a possible function for pervasive transcription. Science. 2007;316(5830):1484–1488. doi: 10.1126/science.1138341. - DOI - PubMed
    1. Kapranov P, Drenkow J, Cheng J, Long J, Helt G, Dike S, Gingeras TR. Examples of the complex architecture of the human transcriptome revealed by RACE and high-density tiling arrays. Genome Res. 2005;15(7):987–997. doi: 10.1101/gr.3455305. - DOI - PMC - PubMed
    1. Carninci P, Kasukawa T, Katayama S, Gough J, Frith MC, Maeda N, Oyama R, Ravasi T, Lenhard B, Wells C. et al.The transcriptional landscape of the mammalian genome. Science. 2005;309(5740):1559–1563. doi: 10.1126/science.1112014. - DOI - PubMed

Publication types

MeSH terms

LinkOut - more resources