. 2011 Feb 20;410(2):307-15.
doi: 10.1016/j.virol.2010.11.019. Epub 2010 Dec 21.

The HTLV-1 hbz antisense gene indirectly promotes tax expression via down-regulation of p30(II) mRNA

Affiliations

The HTLV-1 hbz antisense gene indirectly promotes tax expression via down-regulation of p30(II) mRNA

Gunjan Choudhary et al. Virology. .

Abstract

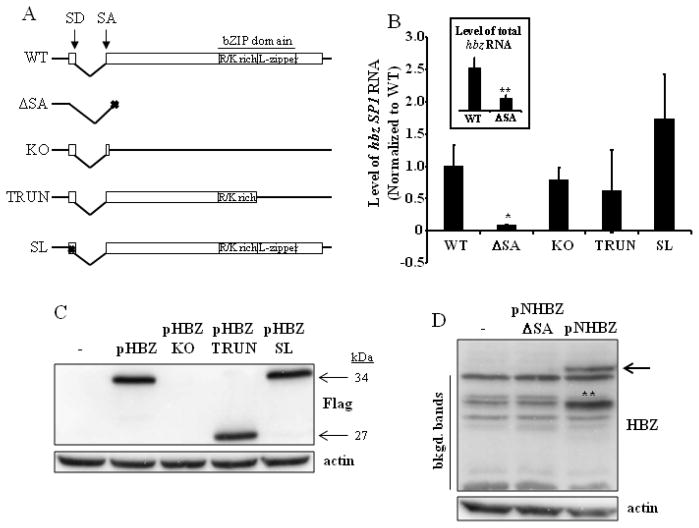
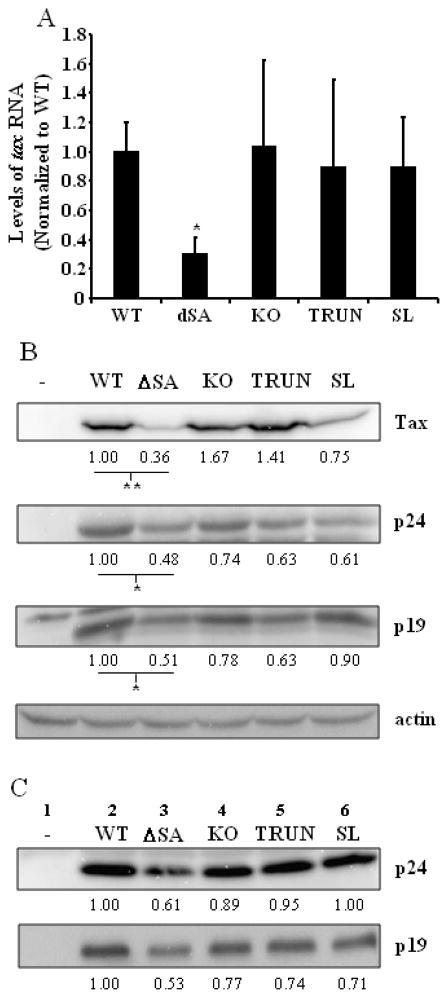
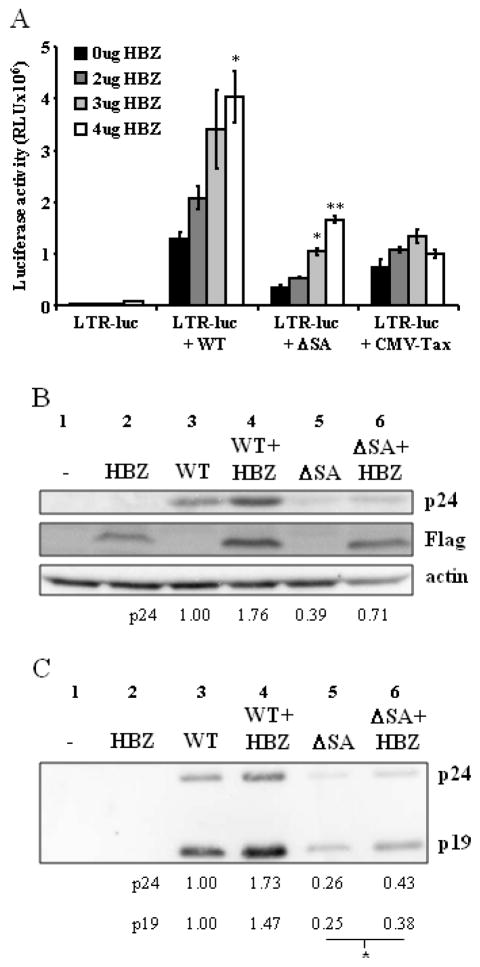
Human T-cell leukemia virus type 1 (HTLV-1) basic leucine zipper factor (HBZ) is transcribed from the antisense genomic DNA strand and functions differently in its RNA and protein forms. To distinguish between the roles of hbz mRNA and HBZ protein, we generated mutants in a proviral clone that specifically disrupt the hbz gene product. A proviral clone with a splice acceptor mutation that disrupts expression of the predominant hbz mRNA resulted in lower levels of tax mRNA. Heterologous hbz expression restored Tax activity in cells expressing this mutant clone. In contrast, proviral mutants that disrupt HBZ protein did not affect levels of tax mRNA. Expression of hbz resulted in lower levels of p30(II) mRNA. Mutation of p30(II) overcame the effects of the splice acceptor mutation of hbz, and restored tax expression. Thus, there is a complex interplay of viral regulatory proteins controlling levels of HTLV-1 gene expression.


Figures

Fig. 1
Fig. 1. Schematic representation of the HTLV-1 genome
The viral mRNAs, their direction of transcription and location of the open reading frames (black boxes) are shown. hbz SP1 and SP2 are two spliced variants of hbz mRNA, while hbz US is the unspliced transcript. The dotted lines represent the introns removed after mRNA splicing. The arrows represent the primers used to amplify the viral mRNAs for the RT-PCR assays. The white cross in p30 represents the location of the p30 stop codon, introduced to generate the Δp30 mutants. The black line above hbz SP1 represents the location of the stem-loop structure in hbz.
Fig. 2
Fig. 2. Analysis of the hbz mRNA transcript and HBZ protein
(A) Schematic representation of wild-type HBZ (WT), with its splice donor (SD) and acceptor (SA) sites and bZIP domain indicated. The four HBZ mutants generated for this study are also depicted. These mutants were made in the context of the pACH proviral clone. ΔSA, splice-deficient mutant; KO, knockout mutant; TRUN, truncation mutant; SL, stem-loop mutant. (B) 293T cells were transfected with the pACH.HBZ-WT or mutant plasmids. Total RNA was isolated 96h post-transfection, and the hbz SP1 mRNA amplified by real-time RT-PCR using primers shown in Fig. 1. Background values were subtracted and data normalized to WT. GAPDH was amplified as an internal control, and did not differ significantly between samples. These results represent an average of at least three independent experiments. Inset, total hbz mRNA was amplified by real-time RT-PCR using the primers within exon 2 of the hbz gene shown in Fig. 1. Background values were subtracted and data normalized to WT (ΔSA value is 0.31). Student’s two-tailed t tests were performed to determine significant differences between samples (*, P < 0.05; **, P < 0.01). (C) 293T cells were transfected with pHBZ1 (pHBZ) or mutant HBZ expression plasmids. Western blot analysis was carried out to show HBZ-flag expression from these plasmids, using anti-Flag antibody. The size of the proteins are indicated to the right of the blot. Detection of actin was carried out as a loading control. (D) 293T cells were transfected with pNHBZ or pNHBZ-ΔSA expression plasmids. Western blot analysis was carried out to show HBZ expression (arrow) from these plasmids, using anti-HBZ antibody. Detection of actin was carried out as a loading control. The background bands (bkgd. bands) are indicated to the left of the blot. **, the intensity of this band (as compared to the others) is probably due to protein degradation. It cannot represent an HBZ protein translated using an internal ATG, since there is no start site that would produce a protein of that size.
Fig. 3
Fig. 3. HTLV-1 gene expression in the absence of hbz mRNA or HBZ protein
(A) 293T cells were transfected with the pACH.HBZ-WT or mutant plasmids. Total RNA was isolated 96h post-transfection, and the tax mRNA amplified by real-time RT-PCR, using primers shown in Fig. 1. GAPDH was amplified as an internal control, and did not exhibit significant differences between samples. These results represent an average of four independent experiments. Student’s two-tailed t tests were performed to determine significant differences between samples (*, P < 0.05). (B and C) Western blot analysis was carried out to measure levels of Tax and Gag (p19 and p24) proteins in the (B) lysates and (C) viral supernatant. Detection of actin was carried out as a loading control. The numbers above the blots represent the lane numbers, while the numbers below the blots represent the densitometry signal of the bands. A representative experiment is shown from a total of three experiments. Student’s two-tailed t tests were performed to determine significant differences between samples (B; *, P < 0.05; **, P < 0.01). Significant differences were seen between the WT and ΔSA samples (Tax: P = 0.0002, p24: P = 0.0462, p19: P = 0.0488), whereas no differences were seen between the WT and KO (Tax: P = 0.76, p24: P = 0.81, p19: P = 0.82), WT and TRUN (Tax: P = 0.58, p24: P = 0.53, p19: P = 0.38), or WT and SL (Tax: P = 0.08, p24: P = 0.11, p19: P = 0.79) samples.
Fig. 4
Fig. 4. Trans-complementation with heterologous hbz rescues the defect seen with the mutation of hbz in the pACH infectious clone
(A) 293T cells were co-transfected with LTR-luc, and with the pACH.HBZ-WT or pACH.HBZ-ΔSA plasmids, or CMV-Tax, in the presence of increasing amounts of pHBZ. Luciferase assays were carried out 48h post-transfection. Student’s two-tailed t tests were performed to determine significant differences between samples (*, P < 0.05; **, P < 0.01). A representative experiment is shown from three total experiments. (B and C) 293T cells were transfected with the pACH.HBZ-WT or pACH.HBZ-ΔSA plasmids in the presence or absence of pHBZ. At 96h post-transfection Western blot analysis was carried out to measure levels of Gag (p19 and p24) proteins in the (B) lysates and (C) viral supernatant. Detection of actin was carried out as a loading control. The numbers above the blots represent the lane numbers, while the numbers below the blots represent the densitometry signal of the bands. Student’s two-tailed t tests were performed to determine significant differences between samples (*, P < 0.05).
Fig. 5
Fig. 5. Expression of hbz depresses p30II levels, and loss of p30II compensates for loss of hbz
(A) 293T cells were transfected with pMHp30IIHA1 (p30) and increasing amounts of either pHBZ2 (HBZ) or pmHBZ (mHBZ). Total RNA was isolated 48h post-transfection, and the p30 mRNA amplified by real-time RT-PCR. GAPDH was amplified as an internal control, and did not exhibit significant differences between samples. A representative experiment is shown from two experiments. Student’s two-tailed t tests were performed to determine significant differences between samples (**, P < 0.01). (B) 293T cells were transfected with pMHp30IIHA1 (p30) and either HBZ, mHBZ, pNHBZ, or pNHBZ-ΔSA. Western blot analysis was carried out 48h post-transfection to measure levels of HBZ and p30 protein. Detection of actin was carried out as a loading control. The numbers below the blots represent the densitometry signal of the bands, normalized to levels of actin. (C and D) 293T cells were transfected with the pACH.HBZ-WT or pACH.HBZ-ΔSA plasmids with or without the p30II mutation, WTΔp30 and ΔSAΔp30. At 48h post-transfection, Western blot analysis was carried out on the (C) lysates and (D) viral supernatant for levels of viral Gag (p19 and p24). *, indicates background bands. Detection of actin was carried out as a loading control. The numbers above the blots represent the lane numbers, while the numbers below the blots represent the densitometry signal of the bands.
Fig. 6
Fig. 6. Model for effect of hbz on tax
Schematic representation of a possible mechanism for hbz’s control of tax: (1) hbz mRNA inhibits p30II mRNA, which (2) leads to a reduction in the amount of p30II protein. Thus, less p30II is translocated to the nucleus, and as a result, (3) less tax mRNA is retained in the nucleus. (4) This results in the synthesis of more Tax protein, leading to an increase in viral gene expression and virus production.

Similar articles

Cited by

References

    1. Albrecht B, Lairmore MD. Critical role of human T-lymphotropic virus type 1 accessory proteins in viral replication and pathogenesis. Microbiol Mol Biol Rev. 2002;66(3):396–406. table of contents. - PMC - PubMed
    1. Arnold J, Yamamoto B, Li M, Phipps AJ, Younis I, Lairmore MD, Green PL. Enhancement of infectivity and persistence in vivo by HBZ, a natural antisense coded protein of HTLV-1. Blood. 2006;107(10):3976–82. - PMC - PubMed
    1. Arnold J, Zimmerman B, Li M, Lairmore MD, Green PL. Human T-cell leukemia virus type-1 antisense-encoded gene, Hbz, promotes T-lymphocyte proliferation. Blood. 2008;112(9):3788–97. - PMC - PubMed
    1. Basbous J, Arpin C, Gaudray G, Piechaczyk M, Devaux C, Mesnard JM. The HBZ factor of human T-cell leukemia virus type I dimerizes with transcription factors JunB and c-Jun and modulates their transcriptional activity. J Biol Chem. 2003;278(44):43620–7. - PubMed
    1. Boxus M, Willems L. Mechanisms of HTLV-1 persistence and transformation. Br J Cancer. 2009;101(9):1497–501. - PMC - PubMed

Publication types

MeSH terms

Substances