. 2011 Mar;32(9):2256-64.
doi: 10.1016/j.biomaterials.2010.11.065. Epub 2010 Dec 21.

Modulus-driven differentiation of marrow stromal cells in 3D scaffolds that is independent of myosin-based cytoskeletal tension

Affiliations

Modulus-driven differentiation of marrow stromal cells in 3D scaffolds that is independent of myosin-based cytoskeletal tension

Sapun H Parekh et al. Biomaterials. 2011 Mar.

Abstract

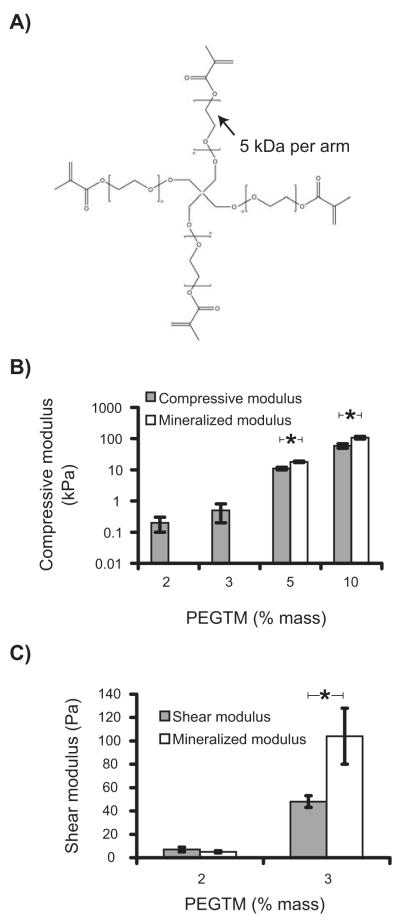
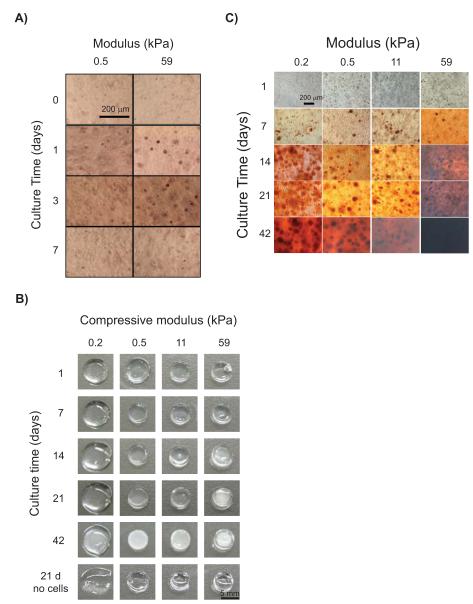
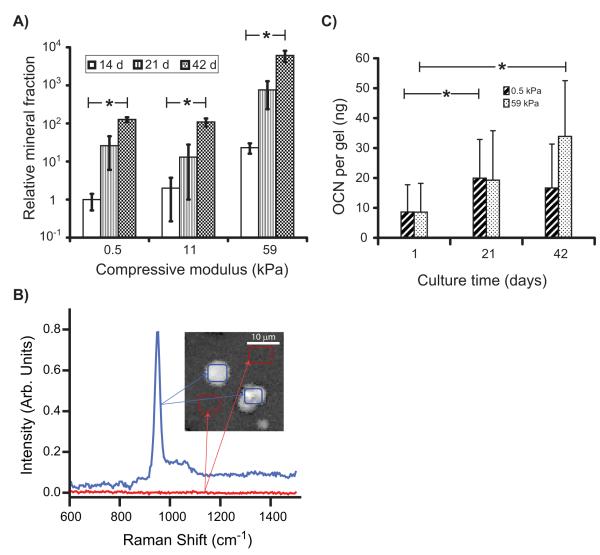
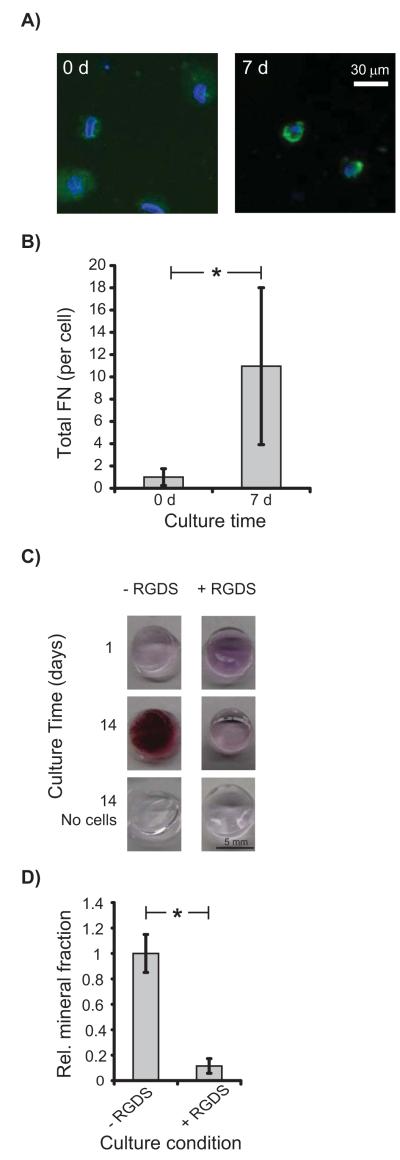
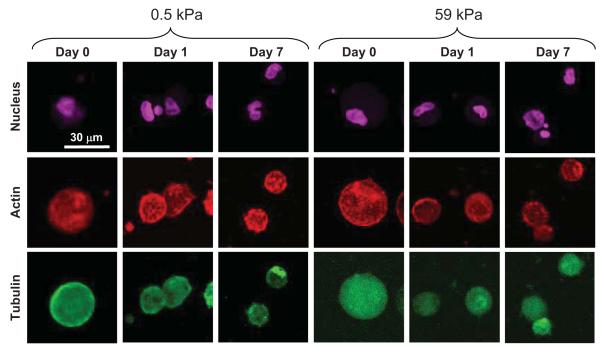
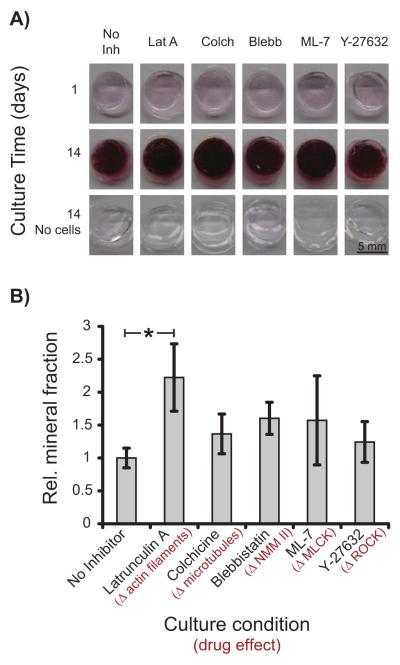
Proliferation and differentiation of cells are known to be influenced by the physical properties of the extracellular environment. Previous studies examining biophysics underlying cell response to matrix stiffness utilized a two-dimensional (2D) culture format, which is not representative of the three-dimensional (3D) tissue environment in vivo. We report on the effect of 3D matrix modulus on human bone marrow stromal cell (hBMSC) differentiation. hBMSCs underwent osteogenic differentiation in poly(ethylene glycol) hydrogels of all modulus (300-fold modulus range, from 0.2 kPa to 59 kPa) in the absence of osteogenic differentiation supplements. This osteogenic differentiation was modulus-dependent and was enhanced in stiffer gels. Osteogenesis in these matrices required integrin-protein ligation since osteogenesis was inhibited by soluble Arginine-Glycine-Aspartate-Serine peptide, which blocks integrin receptors. Immunostained images revealed lack of well-defined actin filaments and microtubules in the encapsulated cells. Disruption of mechanosensing elements downstream of integrin binding that have been identified from 2D culture such as actin filaments, myosin II contraction, and RhoA kinase did not abrogate hBMSC material-driven osteogenic differentiation in 3D. These data show that increased hydrogel modulus enhanced osteogenic differentiation of hBMSCs in 3D scaffolds but that hBMSCs did not use the same mechanosensing pathways that have been identified in 2D culture.


Figures

Figure 1
Figure 1
(A) Chemical structure of the PEGTM monomer with four methacrylate end-groups that facilitate formation of the hydrogel by chemical crosslinking. (B) Plot of compressive modulus of hydrogels for different mass fractions of PEGTM. (C) Softer gels (2 % and 3 % PEGTM) were characterized in shear modulus as well due to their lower compressive modulus. Graphs also show compressive (B) and shear (C) moduli of mineralized scaffolds at 42 d culture with hBMSCs. Statistical differences (p < 0.05, t-test, n = 4) are indicated by asterisk.
Figure 2
Figure 2
hBMSC osteogenic differentiation in 3D PEGTM scaffolds increased with compressive modulus. (A) Alkaline phosphatase staining of hBMSCs at 0 d, 1 d, 3 d, and 7 d showed enzyme production peaked by 3 d in both 0.5 kPa and 59 kPa scaffolds, indicating early osteogenic differentiation. (B) Representative photographs of hydrogel scaffolds showing that mineralization by hBMSCs in PEGTM scaffolds increased with time and modulus. Mineral desposition in the gels caused a change in appearance from transparent to white. Control scaffolds without cells appeared transparent at 21 d, confirming that mineralization is a specific response from hBMSC osteogenic differentiation in the scaffolds. (C) Alizarin Red S staining demonstrated calcium deposition in all scaffolds by hBMSCs by 7 d and staining became more intense with time and modulus.
Figure 3
Figure 3
Quantitative analysis of osteogenic differentiation in 3D PEG scaffolds. (A) μCT analysis of mineral deposits demonstrated that the mineralized volume fraction in all scaffolds increased with modulus and time. All mineralized fractions were normalized to the mineral volume measured in 0.5 kPa gels at 14 d (n = 3). (B) Chemical imaging by CARS microscopy of 59 kPa gels containing hBMSCs cultured for 21 days. CARS identified a characteristic phosphate peak at 952 cm−1 that corresponded to a (phosphate) resonance found in amorphous calcium phosphate (blue trace). Areas of the gel without cells (red trace) showed no peaks. (Inset) CARS image built from the 952 cm−1 where white indicates areas rich in calcium phosphate in the scaffold. Spectra from the blue and red regions of the image were used to generate the corresponding traces in plot. (C) Osteocalcin (OCN) produced by hBMSCs increased with time in both soft and stiff scaffolds over time measured by ELISA (n = 4). Statistical differences (p < 0.05, 1-way ANOVA with Tukey’s) are indicated with asterisk.
Figure 4
Figure 4
hBMSCs in 11 kPa PEGTM scaffolds synthesized FN and RGDS peptide blocked osteogenesis. (A) Little FN was detected by antibody staining in hydrogels cultured 0 d with hBMSCs. However, gels at 7 d demonstrated FN deposits as shown by the bright green pericellular fluorescence. Cell nuclei and FN were blue and green, respectively. (B) Total pericellular FN per hBMSC increased 10-fold from 0 d (n = 25 cells) to 7 d (n = 16 cells). FN images were identically thresholded for 0 d and 7 d to mark the FN area around nuclei, and normalized FN pixel values (by the background fluorescence) were integrated over this area. The graph showed total FN per cell relative to 0 d. (C) Alizarin Red S staining of hBMSCs cultured with RGDS peptide reduced mineralization. Mineralization was inhibited in scaffolds cultured with RGDS compared to scaffolds cultured without RGDS. (D) Scaffolds treated with RGDS peptide exhibited decreased mineralization at 14 d as measured by μCT (n = 3). Statistical difference (p < 0.05, 1-way ANOVA with Tukey’s) is indicated by asterisk.
Figure 5
Figure 5
Maximum intensity projections of confocal image stacks of hBMSCs in 3D PEGTM scaffolds of 0.5 kPa and 59 kPa. F-actin (red), tubulin (green) and nuclear (purple) staining showed that cells maintained a rounded morphology independent of scaffold modulus. hBMSCs in both soft and stiff scaffolds did not exhibit well-defined actin or microtubule structures.
Figure 6
Figure 6
Cytoskeletal integrity was not required for osteogenic differentiation in 3D PEGTM scaffolds. (A) Alizarin Red S staining of hBMSCs in 11 kPa scaffolds treated with inhibitors of actin polymerization, microtubule formation, myosin contraction, and ROCK inhibitors revealed that hBMSCs underwent osteogenesis regardless of cytoskeletal inhibition. (B) Quantification of mineralized volume with μCT showed that inhibitors did not block hBMSC osteogenesis at 14 d(n = 3). Statistical differences (p < 0.05, 1-way ANOVA with Tukey’s) are indicated by asterisk.

References

    1. Barry FP, Murphy JM. Mesenchymal stem cells: clinical applications and biological characterization. Int J Biochem Cell B. 2004;36(4):568–84. - PubMed
    1. Engler AJ, Sen S, Sweeney HL, Discher DE. Matrix elasticity directs stem cell lineage specification. Cell. 2006;126(4):677–89. - PubMed
    1. Winer JP, Janmey PA, McCormick ME, Funaki M. Bone marrow-derived human mesenchymal stem cells become quiescent on soft substrates but remain responsive to chemical or mechanical stimuli. Tissue Eng Part A. 2009;15(1):147–54. - PubMed
    1. Rowlands AS, George PA, Cooper-White JJ. Directing osteogenic and myogenic differentiation of MSCs: interplay of stiffness and adhesive ligand presentation. Am J Physiol Cell Physiol. 2008;295(4):1037–44. - PubMed
    1. Zhou JA, Kim HY, Wang JHC, Davidson LA. Macroscopic stiffening of embryonic tissues via microtubules, RhoGEF and the assembly of contractile bundles of actomyosin. Development. 2010;137(16):2785–94. - PMC - PubMed

Publication types

MeSH terms