. 2011 Apr 1;286(13):11506-18.
doi: 10.1074/jbc.M110.154526. Epub 2010 Dec 21.

Differential G-protein-coupled receptor phosphorylation provides evidence for a signaling bar code

Affiliations

Differential G-protein-coupled receptor phosphorylation provides evidence for a signaling bar code

Adrian J Butcher et al. J Biol Chem. .

Abstract

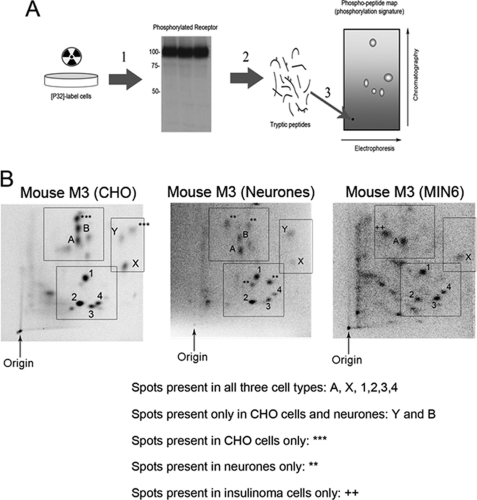
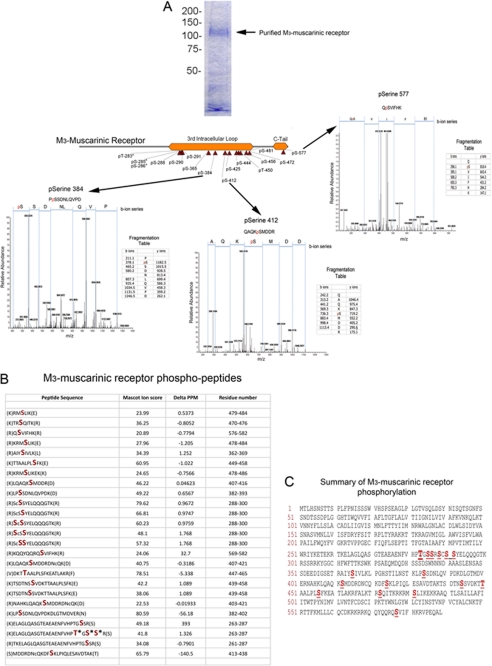
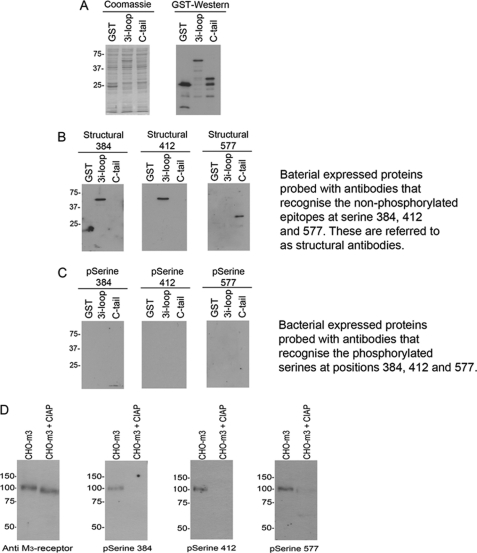
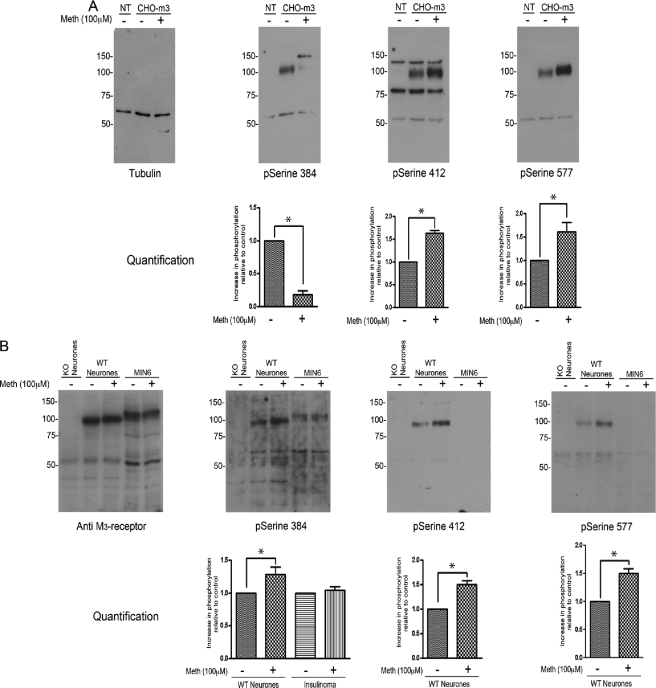
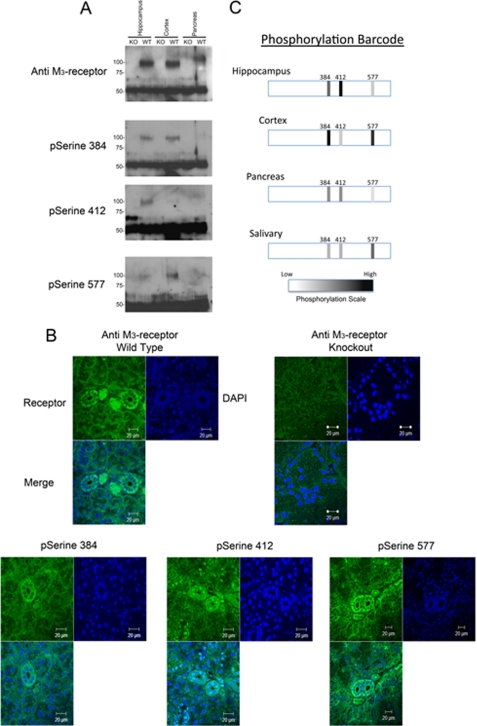
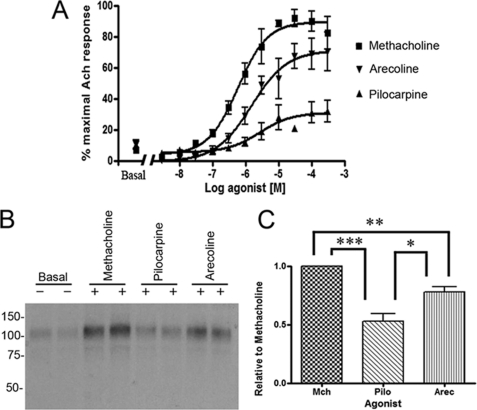
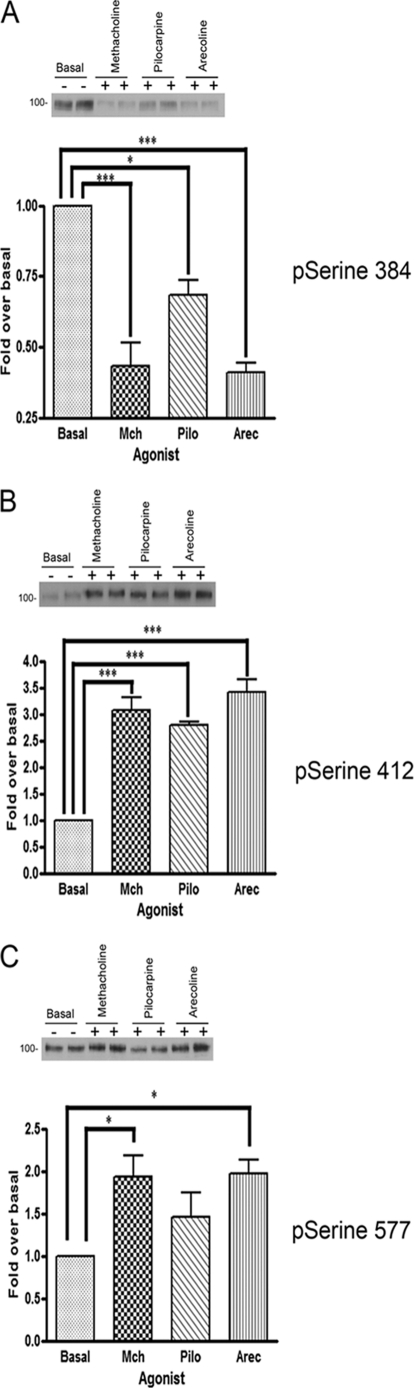
G-protein-coupled receptors are hyper-phosphorylated in a process that controls receptor coupling to downstream signaling pathways. The pattern of receptor phosphorylation has been proposed to generate a "bar code" that can be varied in a tissue-specific manner to direct physiologically relevant receptor signaling. If such a mechanism existed, receptors would be expected to be phosphorylated in a cell/tissue-specific manner. Using tryptic phosphopeptide maps, mass spectrometry, and phospho-specific antibodies, it was determined here that the prototypical G(q/11)-coupled M(3)-muscarinic receptor was indeed differentially phosphorylated in various cell and tissue types supporting a role for differential receptor phosphorylation in directing tissue-specific signaling. Furthermore, the phosphorylation profile of the M(3)-muscarinic receptor was also dependent on the stimulus. Full and partial agonists to the M(3)-muscarinic receptor were observed to direct phosphorylation preferentially to specific sites. This hitherto unappreciated property of ligands raises the possibility that one mechanism underlying ligand bias/functional selectivity, a process where ligands direct receptors to preferred signaling pathways, may be centered on the capacity of ligands to promote receptor phosphorylation at specific sites.


Figures

FIGURE 1.
FIGURE 1.
Differential phosphorylation of the M3-muscarinic receptor in CHO cells, MIN6 insulinoma cells, and CG neurons. A, schematic of the method employed in generating a tryptic phosphopeptide map. Step 1, cells are labeled with [32P]orthophosphate and stimulated with agonist for 5 min. The cells are then lysed and the receptors immunoprecipitated and resolved by SDS-PAGE. An autoradiograph of the gel determines the position of the radiolabeled receptor, which is excised from the gel. Step 2, excised gel band is tryptically digested. Step 3, tryptic digest is spotted onto a cellulose plate and subjected to electrophoresis and ascending chromatography to resolve the tryptic peptides. The position of the phosphopeptides is determined by exposing the gel in a phosphorimager. B, tryptic phosphopeptide maps of the mouse M3-muscarinic receptor immunoprecipitated from CHO-m3 (CHO), CG neurons, and MIN6 insulinoma cells. For ease of viewing, the autoradiographs are divided into three sections denoted by the boxes. Phosphopeptide “spots” are labeled to designate spots that are unique to a cell type or shared between cell types (see key on the figure). Each autoradiograph is representative of at least three independent experiments.
FIGURE 2.
FIGURE 2.
Determination of the sites of phosphorylation on the M3-muscarinic receptor by mass spectrometry. A, recombinant mouse M3-muscarinic receptor expressed in CHO cells was stimulated with methacholine (100 μm) for 5 min. Membranes were then prepared, and the receptor was purified. The receptor was subjected to tryptic digestion, and the peptides were analyzed by mass spectrometry. Shown is a schematic indicating the phospho-acceptor sites in the third intracellular loop and C-terminal tail. Also shown are typical LC-MS/MS traces that identify serines 384, 412, and 577 as phosphoserines. B, list of the phosphopeptides identified by LC-MS/MS. The phosphorylated residue is highlighted in red. Note that where residues are labeled with an asterisk, it was not possible to determine which of the residues were phosphorylated. All the peptides shown were observed in at least two independent experiments. C, schematic of the full amino acid sequence of the mouse M3-muscarinic receptor indicating the position of the phosphorylated residues in red and underlined.
FIGURE 3.
FIGURE 3.
Characterization of phospho-specific antibodies raised against serines 384, 412, and 577. Crude bacterial lysates containing either GST or GST fused to the third intracellular loop of the mouse M3-muscarinic receptor (3i-loop) or C-terminal tail (C-tail) were probed with the following antibodies. A, antibodies against GST. This served as a loading control as did the Coomassie stain of gel. B, nonphospho-specific antibodies (structural) generated from the immunization. C, purified phospho-specific antibodies. D, CHO cells expressing the recombinant mouse M3-muscarinic receptor were stimulated with methacholine (100 μm) for 5 min. The receptor was then solubilized and immunoprecipitated with an M3-muscarinic receptor specific monoclonal antibody. The nitrocellulose was then probed with the phospho-specific antibodies to serines 384, 412, and 577. Where indicated the immunoprecipitated receptor was treated with calf intestinal phosphatase (CIAP) to remove phosphates from the receptor. The sample was also probed with an antibody against the M3-muscarinic receptor (anti-M3-receptor) as a loading control. The data shown are representative of at least two experiments.
FIGURE 4.
FIGURE 4.
Phospho-specific antibodies reveal differential phosphorylation of the M3-muscarinic receptor. A, either nontransfected CHO cells (NT) or CHO cells expressing the mouse M3-muscarinic receptor (CHO-m3) were stimulated with or without methacholine (Meth) for 5 min. The cells were then lysed, and the lysate was probed in a Western blot with receptor phospho-specific antibodies. Shown also is a loading control probed for tubulin. Graphs representing quantification of the blots are shown below the autoradiographs. B, MIN6 insulinoma cells and primary cultures of CG neurons derived from wild-type mice (WT) or mice where the M3-muscarinic receptor was knocked out (KO) were processed as described in A above. As a loading control, the lysate was probed for total M3-muscarinic receptor content (anti-M3-receptor). Shown are representative blots and below each blot graphical quantification. Graphs present the means ± S.E. of three independent experiments. *, p < 0.05 (t test).
FIGURE 5.
FIGURE 5.
Differential phosphorylation of the M3-muscarinic receptor in the central nervous system, pancreas, and salivary glands. A, membranes from cerebral cortex, hippocampus, and pancreas were prepared from wild-type (WT) and M3-muscarinic receptor gene knocked out (KO) mice. Membranes were solubilized, and the M3-muscarinic receptor was immunoprecipitated using a receptor monoclonal antibody. The immunoprecipitate was probed in Western blots with M3-muscarinic receptor phospho-specific antibodies against phosphoserine 384, 412, and 577. Shown also is a loading control probed for total M3-muscarinic receptor (anti-M3-receptor). Data are representative of three independent experiments. B, submandibular glands from wild-type and M3-muscarinic receptor knock-out mice were fixed in 10% formalin and processed for immunocytochemistry. Sections were stained with antibodies against the total M3-muscarinic receptor population (anti-M3-receptor) or receptors phosphorylated on serines 384, 412, and 577. Also shown are the DAPI-stained nuclei and the merge of the receptor staining and DAPI. C, results shown in A and B are represented as a bar code describing the relative intensities of receptor phosphorylation on serines 384, 412, and 577 in the different tissues.
FIGURE 6.
FIGURE 6.
Methacholine-, arecoline-, and pilocarpine-mediated inositol phosphate and receptor phosphorylation response. A, concentration-response curve for methacholine (Mch), arecoline (Arec), and pilocarpine (Pilo) in the inositol phosphate response in CHO-m3 cells. B, phosphorylation of the M3-muscarinic receptor in CHO-m3 cells labeled with [32P]orthophosphate in response to muscarinic receptor agonists. C, quantification of the phosphorylation data presented in B. Graphs represent the means ± S.E. of three independent experiments. *, p < 0.05; **, p < 0.01; ***, p < 0.001 (t test).
FIGURE 7.
FIGURE 7.
Muscarinic ligands drive preferential receptor phosphorylation. A, tryptic phosphopeptide maps of the M3-muscarinic receptor expressed in CHO-m3 cells stimulated with a saturating concentration (100 μm) of methacholine (Mch), arecoline (Arec), or pilocarpine (Pilo). Labeled are four spots (1–4), which were compared in intensity with the reference spot marked with an asterisk. B–E, quantification of spots labeled 1–4 in relation to the reference spot. Shown are typical autoradiographs and the cumulative mean data ± S.E. (n = 3). *, p < 0.05; **, p < 0.01 (t test).
FIGURE 8.
FIGURE 8.
Phospho-specific antibodies reveal the capacity of ligands to drive preferential M3-muscarinic receptor phosphorylation. CHO-m3 cells were stimulated with a saturating concentration (100 μm) of methacholine (Mch), arecoline (Arec), or pilocarpine (Pilo). The cells were then lysed, and the receptor was immunoprecipitated with a receptor monoclonal antibody. The immunoprecipitate was then probed with receptor phospho-specific antibodies against phosphoserine 384 (A), phosphoserine 412 (B), and phosphoserine 577 (C). Shown are typical autoradiographs and the cumulative mean data ± S.E. (n = 3). *, p < 0.05; ***, p < 0.001 (t test).

References

    1. Reiter E., Lefkowitz R. J. (2006) Trends Endocrinol. Metab. 17, 159–165 - PubMed
    1. Premont R. T., Gainetdinov R. R. (2007) Annu. Rev. Physiol. 69, 511–534 - PubMed
    1. Tobin A. B., Butcher A. J., Kong K. C. (2008) Trends Pharmacol. Sci. 29, 413–420 - PMC - PubMed
    1. Tobin A. B. (2008) Br. J. Pharmacol. 153, S167–S176 - PMC - PubMed
    1. Torrecilla I., Spragg E. J., Poulin B., McWilliams P. J., Mistry S. C., Blaukat A., Tobin A. B. (2007) J. Cell Biol. 177, 127–137 - PMC - PubMed

Publication types

MeSH terms

Substances

LinkOut - more resources