. 2011 Feb;258(2):505-14.
doi: 10.1148/radiol.10101006. Epub 2010 Dec 21.

Cartilage in anterior cruciate ligament-reconstructed knees: MR imaging T1{rho} and T2--initial experience with 1-year follow-up

Affiliations

Cartilage in anterior cruciate ligament-reconstructed knees: MR imaging T1{rho} and T2--initial experience with 1-year follow-up

Xiaojuan Li et al. Radiology. 2011 Feb.

Abstract

Purpose: To longitudinally evaluate cartilage matrix changes by using magnetic resonance (MR) imaging T1(ρ) (T1 relaxation time in rotating frame) and T2 quantification and to study the relationship between meniscal damage and cartilage degeneration in anterior cruciate ligament (ACL)-reconstructed knees.

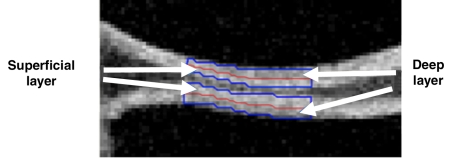
Materials and methods: This was an institutional review board-approved, HIPAA-compliant study. Informed consent was obtained. Twelve patients with acute ACL injuries were imaged with 3.0-T MR imaging at baseline (after injury and prior to ACL reconstruction) and 1 year after ACL reconstruction. Ten age-matched healthy subjects were studied as controls. Cartilage T1(ρ) and T2 were quantified in full thickness, superficial, and deep layers of defined subcompartments at baseline and follow-up in ACL-injured knees and were compared with measures acquired in matched regions of control knees. Meniscal lesions were graded by using modified subscores of the Whole-Organ Magnetic Resonance Imaging Score system.

Results: T1(ρ) values of the posterolateral tibial cartilage in ACL-injured knees were significantly elevated at baseline compared with T1(ρ)values of control knees and were not fully recovered at 1-year follow-up. T1(ρ) values of weight-bearing medial femorotibial cartilage in ACL-injured knees were significantly elevated at 1-year follow-up compared with those of control knees. No significant differences in T2 values between ACL-injured and control knees were found. Patients with lesions in the posterior horn of the medial meniscus showed a greater increase of T1(ρ) and T2 from baseline to follow-up in adjacent cartilage than patients without lesions in the medial meniscus.

Conclusion: Quantitative MR imaging T1(ρ) and T2 enable detection of changes in the cartilage matrix of ACL-reconstructed knees as early as 1 year after ACL reconstruction.


Figures

Figure 1a:
Figure 1a:
High-spatial-resolution spoiled gradient-echo MR images show subcompartment definition in (a) lateral and (b) medial sides of the knee joint. LFC 3 and MFC 3 and LT 2 and MT 2 are contacting regions of femoral and tibial cartilage during standing, respectively. LFC 2 and MFC 2 and LT 1 and MT 1 are regions above and below the anterior horn of meniscus, respectively, and LFC 4 and MFC 4 and LT 3 and MT 3 are regions above and below the posterior horn of meniscus, respectively. LFC 1 and MFC 1 (not shown) and LFC 5 and MFC 5 are anterior and posterior non–weight-bearing portions of the femoral condyle during standing, respectively. (c) MR image shows laminar analysis of cartilage relaxation time quantification. Two equally spaced layers, deep and superficial, were defined. MFC 3 and MT 2 are shown as examples.
Figure 1b:
Figure 1b:
High-spatial-resolution spoiled gradient-echo MR images show subcompartment definition in (a) lateral and (b) medial sides of the knee joint. LFC 3 and MFC 3 and LT 2 and MT 2 are contacting regions of femoral and tibial cartilage during standing, respectively. LFC 2 and MFC 2 and LT 1 and MT 1 are regions above and below the anterior horn of meniscus, respectively, and LFC 4 and MFC 4 and LT 3 and MT 3 are regions above and below the posterior horn of meniscus, respectively. LFC 1 and MFC 1 (not shown) and LFC 5 and MFC 5 are anterior and posterior non–weight-bearing portions of the femoral condyle during standing, respectively. (c) MR image shows laminar analysis of cartilage relaxation time quantification. Two equally spaced layers, deep and superficial, were defined. MFC 3 and MT 2 are shown as examples.
Figure 1c:
Figure 1c:
High-spatial-resolution spoiled gradient-echo MR images show subcompartment definition in (a) lateral and (b) medial sides of the knee joint. LFC 3 and MFC 3 and LT 2 and MT 2 are contacting regions of femoral and tibial cartilage during standing, respectively. LFC 2 and MFC 2 and LT 1 and MT 1 are regions above and below the anterior horn of meniscus, respectively, and LFC 4 and MFC 4 and LT 3 and MT 3 are regions above and below the posterior horn of meniscus, respectively. LFC 1 and MFC 1 (not shown) and LFC 5 and MFC 5 are anterior and posterior non–weight-bearing portions of the femoral condyle during standing, respectively. (c) MR image shows laminar analysis of cartilage relaxation time quantification. Two equally spaced layers, deep and superficial, were defined. MFC 3 and MT 2 are shown as examples.
Figure 2a:
Figure 2a:
(a) T1ρ and (b) T2 maps of healthy control knee. Mean values from full thickness, superficial, and deep layers in each defined subcompartment, as shown in Figure 1, were calculated. Laminar distribution (higher values in superficial layers and lower values in deep layers) was observed on T1ρ and T2 maps.
Figure 2b:
Figure 2b:
(a) T1ρ and (b) T2 maps of healthy control knee. Mean values from full thickness, superficial, and deep layers in each defined subcompartment, as shown in Figure 1, were calculated. Laminar distribution (higher values in superficial layers and lower values in deep layers) was observed on T1ρ and T2 maps.
Figure 3a:
Figure 3a:
T1ρ and T2 values in full thickness, superficial (Sup), and deep layers of cartilage in defined subcompartments. Graphs show full-thickness cartilage (a) T1ρ and (b) T2 values in subcompartments of femorotibial cartilage. Graphs show T1ρ and T2 values in superficial and deep layers of cartilage in (c) LT 3 and (d) MFC 3. * = P < .05 compared with control knees; # = P < .1 compared with control knees.
Figure 3b:
Figure 3b:
T1ρ and T2 values in full thickness, superficial (Sup), and deep layers of cartilage in defined subcompartments. Graphs show full-thickness cartilage (a) T1ρ and (b) T2 values in subcompartments of femorotibial cartilage. Graphs show T1ρ and T2 values in superficial and deep layers of cartilage in (c) LT 3 and (d) MFC 3. * = P < .05 compared with control knees; # = P < .1 compared with control knees.
Figure 3c:
Figure 3c:
T1ρ and T2 values in full thickness, superficial (Sup), and deep layers of cartilage in defined subcompartments. Graphs show full-thickness cartilage (a) T1ρ and (b) T2 values in subcompartments of femorotibial cartilage. Graphs show T1ρ and T2 values in superficial and deep layers of cartilage in (c) LT 3 and (d) MFC 3. * = P < .05 compared with control knees; # = P < .1 compared with control knees.
Figure 3d:
Figure 3d:
T1ρ and T2 values in full thickness, superficial (Sup), and deep layers of cartilage in defined subcompartments. Graphs show full-thickness cartilage (a) T1ρ and (b) T2 values in subcompartments of femorotibial cartilage. Graphs show T1ρ and T2 values in superficial and deep layers of cartilage in (c) LT 3 and (d) MFC 3. * = P < .05 compared with control knees; # = P < .1 compared with control knees.
Figure 4a:
Figure 4a:
T1ρ maps of (a, b) lateral and (c, d) medial side of ACL-injured knee at (a, c) baseline and (b, d) 1-year follow-up. T1ρ values in lateral posterior tibia (LT 3) were elevated significantly in ACL-injured knees at baseline and remained high at 1-year follow-up despite resolution of bone bruise in the LT. T1ρ values in the contacting area of MFC and MT were significantly elevated in ACL-injured knees at 1-year follow-up. See Figure 2 for color bar.
Figure 4b:
Figure 4b:
T1ρ maps of (a, b) lateral and (c, d) medial side of ACL-injured knee at (a, c) baseline and (b, d) 1-year follow-up. T1ρ values in lateral posterior tibia (LT 3) were elevated significantly in ACL-injured knees at baseline and remained high at 1-year follow-up despite resolution of bone bruise in the LT. T1ρ values in the contacting area of MFC and MT were significantly elevated in ACL-injured knees at 1-year follow-up. See Figure 2 for color bar.
Figure 4c:
Figure 4c:
T1ρ maps of (a, b) lateral and (c, d) medial side of ACL-injured knee at (a, c) baseline and (b, d) 1-year follow-up. T1ρ values in lateral posterior tibia (LT 3) were elevated significantly in ACL-injured knees at baseline and remained high at 1-year follow-up despite resolution of bone bruise in the LT. T1ρ values in the contacting area of MFC and MT were significantly elevated in ACL-injured knees at 1-year follow-up. See Figure 2 for color bar.
Figure 4d:
Figure 4d:
T1ρ maps of (a, b) lateral and (c, d) medial side of ACL-injured knee at (a, c) baseline and (b, d) 1-year follow-up. T1ρ values in lateral posterior tibia (LT 3) were elevated significantly in ACL-injured knees at baseline and remained high at 1-year follow-up despite resolution of bone bruise in the LT. T1ρ values in the contacting area of MFC and MT were significantly elevated in ACL-injured knees at 1-year follow-up. See Figure 2 for color bar.
Figure 5:
Figure 5:
Hot spot regions with high risk of cartilage damage and degeneration in ACL-reconstructed joints. The lateral posterior tibia experiences the most substantial impact during initial injuries (left). This damage is not fully recovered at 1 year after ACL reconstruction. The medial weight-bearing regions, especially the contacting areas of MFC and MT, are regions with earliest degeneration onset (right).

References

    1. Fu FH, Bennett CH, Ma CB, Menetrey J, Lattermann C. Current trends in anterior cruciate ligament reconstruction. II. Operative procedures and clinical correlations. Am J Sports Med 2000;28(1):124–130 - PubMed
    1. Ferretti A, Conteduca F, De Carli A, Fontana M, Mariani PP. Osteoarthritis of the knee after ACL reconstruction. Int Orthop 1991;15(4):367–371 - PubMed
    1. Daniel DM, Stone ML, Dobson BE, Fithian DC, Rossman DJ, Kaufman KR. Fate of the ACL-injured patient: a prospective outcome study. Am J Sports Med 1994;22(5):632–644 - PubMed
    1. Lohmander LS, Ostenberg A, Englund M, Roos H. High prevalence of knee osteoarthritis, pain, and functional limitations in female soccer players twelve years after anterior cruciate ligament injury. Arthritis Rheum 2004;50(10):3145–3152 - PubMed
    1. von Porat A, Roos EM, Roos H. High prevalence of osteoarthritis 14 years after an anterior cruciate ligament tear in male soccer players: a study of radiographic and patient relevant outcomes. Ann Rheum Dis 2004;63(3):269–273 - PMC - PubMed

Publication types