. 2011 Mar;39(6):e35.
doi: 10.1093/nar/gkq1287. Epub 2010 Dec 21.

seqMINER: an integrated ChIP-seq data interpretation platform

Affiliations

seqMINER: an integrated ChIP-seq data interpretation platform

Tao Ye et al. Nucleic Acids Res. 2011 Mar.

Abstract

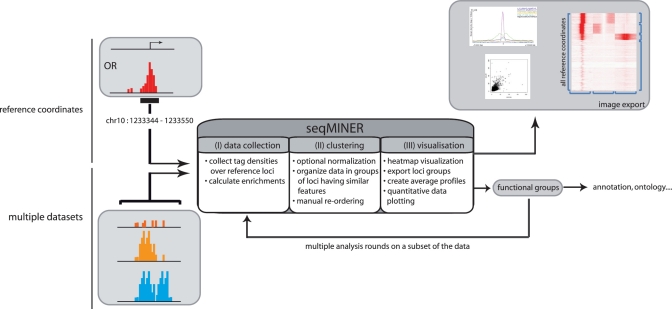
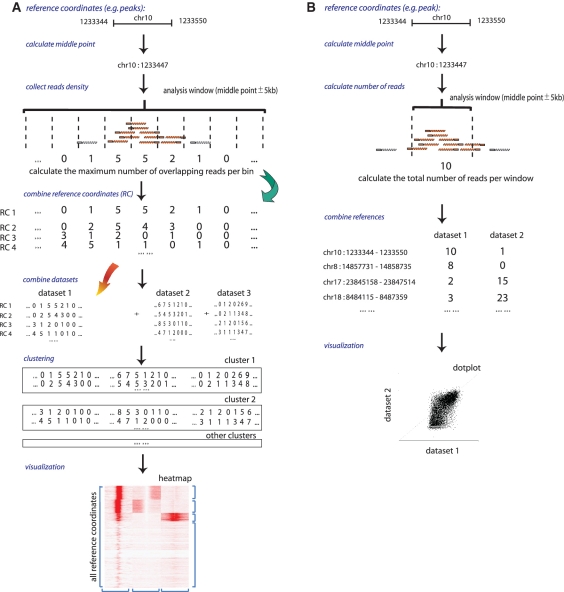
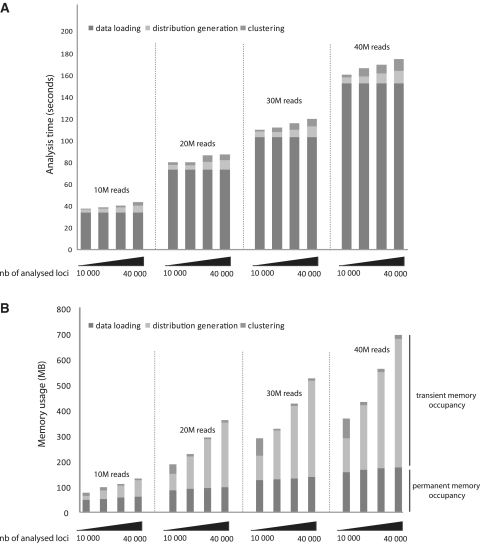
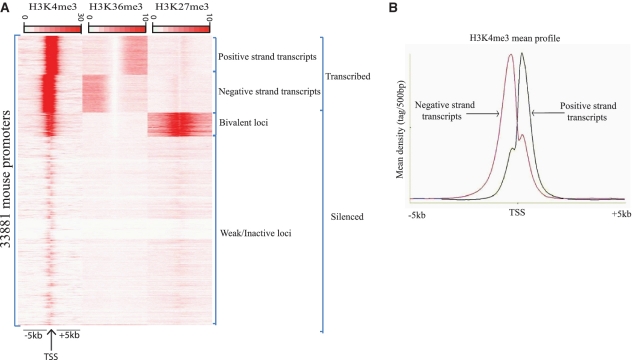
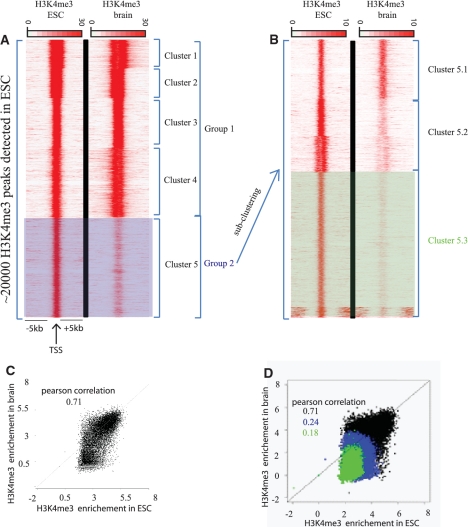
In a single experiment, chromatin immunoprecipitation combined with high throughput sequencing (ChIP-seq) provides genome-wide information about a given covalent histone modification or transcription factor occupancy. However, time efficient bioinformatics resources for extracting biological meaning out of these gigabyte-scale datasets are often a limiting factor for data interpretation by biologists. We created an integrated portable ChIP-seq data interpretation platform called seqMINER, with optimized performances for efficient handling of multiple genome-wide datasets. seqMINER allows comparison and integration of multiple ChIP-seq datasets and extraction of qualitative as well as quantitative information. seqMINER can handle the biological complexity of most experimental situations and proposes methods to the user for data classification according to the analysed features. In addition, through multiple graphical representations, seqMINER allows visualization and modelling of general as well as specific patterns in a given dataset. To demonstrate the efficiency of seqMINER, we have carried out a comprehensive analysis of genome-wide chromatin modification data in mouse embryonic stem cells to understand the global epigenetic landscape and its change through cellular differentiation.


Figures

Figure 1.
Figure 1.
Schematic representation of the general workflow of seqMINER. seqMINER takes as an input a single set of reference loci (i.e. gene promoters or binding sites) and multiple raw sequencing datasets. seqMINER can collect tag densities or calculate enrichment values around the set of reference coordinates. Using a combination of automated clustering and manual reordering methods, seqMINER helps the user to create functional groups within the reference set. Each specific sub-group in the dataset can be visualized as heatmaps, dotplots or average plots and the groups of loci can be exported for further analysis.
Figure 2.
Figure 2.
Schematic representation of the algorithms for each method implemented in seqMINER. In both methods, prior to quantification, reads are extended from a user-defined value (default 200 bp). (A) Density array method: a user defined number of bins are created in a fixed window around the reference coordinate and for each bin the maximal number of overlapping reads is computed in each dataset, the collected values are pooled and submitted to clustering process and the generated clusters are visualized as heatmap. (B) Enrichment based method: the number of tags presents or overlapping a user-defined window (default 2 kb) around the reference site are counted. The values from the different datasets are computed and ploted.
Figure 3.
Figure 3.
Time and memory required to complete a typical analysis with seqMINER. (A) Time required for the different stages of the analysis (namely data loading, distributions generation and clustering) by seqMINER, using raw ChIP-seq datasets of various sizes (10, 20, 30 and 40M reads) and various number of reference coordinates (10 000, 20 000, 30 000, 40 000 reference positions). The analysis was performed on a PC running under windows with standard performances (CPU-3.0 GHz core-duo; RAM-4 GB). (B) Memory required for the different stages of the analysis tested as above. Note that only the data loading step stores objects in memory, the two subsequent steps free the memory once completed allowing multiple successive analyses with limited memory attribution (<500 MB).
Figure 4.
Figure 4.
Characterization of epigenetic profiles of mouse promoters in ESCs using seqMINER. (A) Read densities of regions surrounding the whole set of TSS (assumed to be the 5′-end of the annotated transcript) of mouse genes from ENSEMBL (v58). TSSs were used as reference coordinates to collect data in publicly available H3K4me3, H3K36me3 and H3K27me3 datasets. Tag densities from each ChIP-seq dataset were collected within a window of 10 kb around the reference coordinates, the collected data were subjected to k-means clustering (using linear normalization). The major groups and clusters are indicated. (B) Using seqMINER, the average profile for selected clusters was automatically calculated and plotted. The H3K4me3 mean profile for transcripts actively transcribed on the negative strand (pink) and positive (blue) strand was calculated and represented.
Figure 5.
Figure 5.
Quantitative changes of H3K4me3 mark in mouse brain cells relative to mESCs. Tag densities of regions surrounding the H3K4me3 enriched loci in ESCs. Publicly available ChIP-seq datasets for H3K4me3 in ESCs and in brain cells were used in this comparative analysis. (A) H3K4me3 enriched loci in ESC were detected using MACS software, these loci were used as reference coordinates. Tag densities from H3K4me3-ESC and H3K4me3-brain datasets were collected within a window of 10 kb around the reference coordinates, and then the density files were subjected to k-means clustering. Two major groups can be isolated: group1 contains loci with significant and equal enrichment of H3K4me3 in both ESC and brain; group 2 contains loci with higher enrichment of H3K4me3 in ESC relative to brain tissue. (B) As a second step of analysis, the loci in group 2 were used as reference. The densities around these loci were recollected and a second round of clustering was performed. After the second round of clustering, three clusters can be isolated: cluster 5.1, 5.2 and 5.3 corresponding to loci weakly, moderately and strongly enriched in H3K4me3 mark in ESC relative to brain, respectively. Note that the bottom of the cluster 5.3 that has H3K4me3 enrichment distant from the cluster center was not considered as a separate entity since we focused our analysis on the differential signal in the cluster center. (C) Quantification of the changes observed between the two conditions. Dot-plot representing H3K4me3 enrichments in ESC versus brain. Enrichments were calculated for H3K4me3-ESC and H3K4me3-brain datasets within a window of 2 kb around the complete set of reference coordinates (black dots), (D) and against previously isolated subsets of the reference coordinates (group2 in blue and subset 5.3 in green).

References

    1. Mikkelsen TS, Ku M, Jaffe DB, Issac B, Lieberman E, Giannoukos G, Alvarez P, Brockman W, Kim TK, Koche RP, et al. Genome-wide maps of chromatin state in pluripotent and lineage-committed cells. Nature. 2007;448:553–560. - PMC - PubMed
    1. Ku M, Koche RP, Rheinbay E, Mendenhall EM, Endoh M, Mikkelsen TS, Presser A, Nusbaum C, Xie X, Chi AS, et al. Genome-wide analysis of PRC1 and PRC2 occupancy identifies two classes of bivalent domains. PLoS Genet. 2008;4:e1000242. - PMC - PubMed
    1. Johnson DS, Mortazavi A, Myers RM, Wold B. Genome-wide mapping of in vivo protein-DNA interactions. Science. 2007;316:1497–1502. - PubMed
    1. Laajala TD, Raghav S, Tuomela S, Lahesmaa R, Aittokallio T, Elo LL. A practical comparison of methods for detecting transcription factor binding sites in ChIP-seq experiments. BMC Genomics. 2009;10:618. - PMC - PubMed
    1. Krebs A, Frontini M, Tora L. GPAT: retrieval of genomic annotation from large genomic position datasets. BMC Bioinformatics. 2008;9:533. - PMC - PubMed

Publication types