. 2011 Apr;39(8):3267-81.
doi: 10.1093/nar/gkq1205. Epub 2010 Dec 21.

c-MYC coordinately regulates ribosomal gene chromatin remodeling and Pol I availability during granulocyte differentiation

Affiliations

c-MYC coordinately regulates ribosomal gene chromatin remodeling and Pol I availability during granulocyte differentiation

Gretchen Poortinga et al. Nucleic Acids Res. 2011 Apr.

Abstract

Loss of c-MYC is required for downregulation of ribosomal RNA (rRNA) gene (rDNA) transcription by RNA Polymerase I (Pol I) during granulocyte differentiation. Here, we demonstrate a robust reduction of Pol I loading onto rDNA that along with a depletion of the MYC target gene upstream binding factor (UBF) and a switch from epigenetically active to silent rDNA accompanies this MYC reduction. We hypothesized that MYC may coordinate these mechanisms via direct regulation of multiple components of the Pol I transcription apparatus. Using gene expression arrays we identified a 'regulon' of Pol I factors that are both downregulated during differentiation and reinduced in differentiated granulocytes upon activation of the MYC-ER transgene. This regulon includes the novel c-MYC target genes RRN3 and POLR1B. Although enforced MYC expression during granulocyte differentiation was sufficient to increase the number of active rRNA genes, its activation in terminally differentiated cells did not alter the active to inactive gene ratio despite increased rDNA transcription. Thus, c-MYC dynamically controls rDNA transcription during granulocytic differentiation through the orchestrated transcriptional regulation of core Pol I factors and epigenetic modulation of number of active rRNA genes.


Figures

Figure 1.
Figure 1.
MYC regulates the epigenetic status of rRNA genes during granulocyte differentiation. (A) Top: schematic of wt MPRO cells induced to differentiate by addition of AGN. Proliferating cells (D0) are treated with AGN and re-characterized after 2 days (D2) and 4 days of differentiation (D4). Middle: morphology of wt MPROs at the stages described above. Bar = 15 µm. Bottom: mean cell volume (MCV) in femtoliters (fl) for wt MPROs at the above stages. Results are the mean ± SEM from four independent experiments. *P < 0.05 and **P < 1.0 × 10−4 compared to D0. (B) Top: nuclei were extracted from wt MPROs at D0, D2 and D4 and subjected to psoralen crosslinking followed by Southern blot analysis of rDNA [representative analysis of previously published data (D0 and D4; 12)]. Middle: quantitated fractions of active and inactive ribosomal genes from the above Southern blot. Bottom: expression of the 45S rRNA precursor by qRT–PCR using primers directed against the 5′ externally and internally transcribed spacers (ETS and ITS, respectively) and normalized to β-2 microglobulin (B2M) expression (n = 4). *P < 0.005 and **P < 5.0 × 10−8 compared to D0. (C) Schematic of a single murine rDNA repeat with the positions of qPCR amplicons indicated: promoter enhancer (ENH); proximal promoter sites of demonstrated factor binding including the upstream control element (UCE) and the core region (CORE); 5′ ETS amplicons (ETS1, 2 and 3); 5′ ITS; the stably expressed 28S rRNA; and transcription termination sequences (T1 and 2). E-boxes associated with amplicons are indicated with white boxes. (D) Left: qChIP analysis of UBF binding at rDNA sequences from (C). Analysis was performed on cells harvested prior to AGN treatment (D0) and at D4 of differentiation where the percent (%) total DNA value represents DNA enrichment with the anti-UBF antibody followed by subtraction of the control rabbit serum (RS) bound DNA (results from a minimum of three independent experiments). *P < 0.05 and **P < 0.005 compared to D4. Right: ChIP-CHOP assay of UBF and RS ChIPs in D0 MPROs. DNA samples were both HpaII and mock digested prior to qRT–PCR analysis using the CORE primers to determine the relative fraction of HpaII-resistant, methylated rDNA (METH) with the remaining fraction designated as unmethylated (UNMETH) (n = 1). (E) MYC-ER MPROs (D0) were induced to differentiate for 36 h (36h) before being treated with either vehicle control (EtOH) or 4-OHT for 24 h (60hE and 60hT, respectively). Cells were harvested at indicated time points and protein lysates were analysed by Western blotting for expression of MYC-ER as compared to Actin (top left) while nuclei were analysed by psoralen crosslinking assay (bottom left) as described in (B). The relative fractions of active and inactive rRNA genes were quantitated and represented graphically (right) (n = 3). *P < 0.05.
Figure 2.
Figure 2.
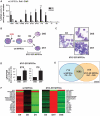
c-MYC regulates a Pol I regulon during MPRO differentiation and in differentiated MPROs with enforced MYC expression. (A) Pol I enrichment at the rDNA repeat normalized to the number of active genes. qChIP analysis of Pol I (anti-POLR1B, 128 kDa subunit) binding at rDNA sequences shown in Figure 1C was performed in D0 and D4 MPROs and analyzed by qPCR as described in Figure 1D. Results are the mean ± SEM from a minimum of three independent experiments. *P < 0.05 and **P < 0.01 compared to D4. The total percentage ChIP values were normalized to the average relative proportion of active genes for D0 (0.44) and D4 (0.19) MPROs as determined by psoralen crosslinking experiments described here (Figure 1B) and in our previously published report (12). (B) Schematic of wt MPRO proliferating cells (D0) induced to differentiate for 2 days (D2) and 4 days (D4). Differentiated MYC-ER MPROs (D4) were treated with EtOH vehicle or 4-OHT for 24 h (D5E and D5T, respectively). (C) Morphology of MYC-ER MPRO cells treated as described in (B). Bar = 15µm. (D) Expression of the 45S rRNA precursor as described for Figure 1B (n = 4). *P < 0.001 compared to D5E. (E) Venn diagram illustrating the overlap between wt MPRO genes whose expression decreases 2-fold or more (n = 4, P < 0.05) from D0 to D4 and those MYC-ER MPRO genes whose expression is increased 2-fold or more (n = 4, P < 0.05) between D5T and D5E. (F) Heatmaps of transcripts from Pol I regulon genes and MYC target genes ODC1 and CCND2 displaying a significant change in expression [1.5-fold or more D0 > D4 (n = 4, P < 5 × 10−4) and D5T > D5E (n = 4, P < 0.05)] in MPRO populations in accordance with MYC expression. The MYC transcriptional antagonist MAD1/MXD1 shows an opposing expression pattern. The mean relative expression levels are represented by a color scale where red, high; black, mean; and green, low expression.
Figure 3.
Figure 3.
Validation of the gene expression array data defining a MYC regulated Pol I regulon. (A) Wt MPROs were harvested for RNA extraction prior to differentiation (D0) and after 2 (D2) and 4 (D4) days of differentiation. qRT–PCR (top panels) and gene expression analysis (signal intensity, bottom panels) were performed to assay expression of MYC and MAD1. (B) qRT–PCR (top) and gene expression analysis (bottom) were performed as described above to assay expression of Pol I regulon members: UBF, TAF1C, RRN3, PAF53 and POLR1B. TTF-1 was also assayed as a non-regulon member. (C) Protein lysates made from wt MPRO cells treated as described in (A) (D0 and D4 only) were analysed by Western blotting for expression of MYC and Pol I regulon members as compared to the Actin loading control. (D) Differentiated MYC-ER MPROs (D4) were treated with EtOH vehicle or 4-OHT for 24 h (D5E and D5T, respectively) before harvesting for RNA extraction. qRT–PCR (top) and gene expression analysis (bottom) were performed to assay expression of CCND2. (E) Protein lysates made from MYC-ER cells treated as described in (D) (D5E and D5T only) were analysed by Western blotting for expression of MYC-ER, POLR1B, UBF and RRN3 compared to Actin. (F) MYC-ER cells were treated as described in (D) and qRT–PCR (top) and gene expression analysis (bottom) were performed to assay expression of Pol I regulon members and TTF-1. All qRT–PCR data was normalized to B2M expression. Results for all graphed data are the mean ± SEM from four independent experiments.
Figure 4.
Figure 4.
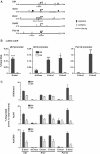
Pol I regulon members are direct c-MYC transcriptional targets. (A) Schematics of promoter regions and nearby exons of select Pol I regulon genes. 2 kb up- and downstream of the TSS (arrows) are represented and canonical (solid black circles) and non-canonical (open grey circles) E-boxes are indicated. Amplicons used for qChIP analysis in (B) and (C) are identified with a bar below the corresponding sequence, except the Rrn3 distal E-box (d-E-box), located 4 kb upstream of the TSS. (B) qChIP analysis of MYC binding at E-boxes at target Pol I regulon genes Ubf, Rrn3 and Polr1b. Wt MPROs were differentiated and qChIP analysis was performed as described in Figure 1D using the anti-c-MYC antibody and control rabbit IgG. Results are the mean ± SEM from a minimum of five independent experiments for all amplicons except Polr1b E-box1 (n = 3). *P < 0.01, **P = 0.001 and ***P < 5.0 × 10−5 compared to D4. (C) qChIP analysis in D0 and D4 wt MPROs using anti-trimethyl H3K4, anti-acetylated H4 and anti-acetylated H3K9 antibodies versus control antisera at E-boxes analyzed in (B) and carried out as described in Figure 1D with the total percentage ChIP values normalized to the mean total percentage for either histone H3 (H3K4me3 and H3K9ac) or H4 (H4ac) at respective amplicons (Supplementary Figure S5A). Results are the mean ± SD from a minimum of two independent experiments.
Figure 5.
Figure 5.
MYC activation is sufficient to recruit Pol I but not to change active rRNA gene ratio in terminally differentiated neutrophils. (A) Proliferating MYC-ER MPROs (D0) were induced to differentiate for 4 days (D4) prior to treatment with either EtOH vehicle or 4-OHT for 24 h (D5E and D5T, respectively) then harvested for psoralen crosslinking analysis as described in Figure 1B. A representative Southern blot of rRNA genes (left) and quantitated active and inactive gene fractions (right) are shown. Results are the mean ± SEM from three independent experiments. (B) MYC-ER MPROs were treated and harvested as in (A) and qChIP analysis for enrichment of select rDNA amplicons from Figure 1C obtained with anti-UBF (left) and anti-Pol I (right) was performed on D5E and D5T samples as described in Figure 1D (UBF ChIP, n = 3; Pol I ChIP, n = 2).

References

    1. Oskarsson T, Trumpp A. The Myc trilogy: lord of RNA polymerases. Nat. Cell Biol. 2005;7:215–217. - PubMed
    1. Gomez-Roman N, Felton-Edkins ZA, Kenneth NS, Goodfellow SJ, Athineos D, Zhang J, Ramsbottom BA, Innes F, Kantidakis T, Kerr ER, et al. Activation by c-Myc of transcription by RNA polymerases I, II and III. Biochem. Soc. Symp. 2006;73:141–154. - PubMed
    1. Jorgensen P, Tyers M. How cells coordinate growth and division. Curr. Biol. 2004;14:R1014–R1027. - PubMed
    1. Grummt I, Pikaard CS. Epigenetic silencing of RNA polymerase I transcription. Nat. Rev. Mol. Cell Biol. 2003;4:641–649. - PubMed
    1. McStay B, Grummt I. The epigenetics of rRNA genes: from molecular to chromosome biology. Annu. Rev. Cell Dev. Biol. 2008;24:131–157. - PubMed

Publication types

MeSH terms

Substances