Comparative Study
. 2011 Mar;336(3):973-82.
doi: 10.1124/jpet.110.172171. Epub 2010 Dec 22.

Pregabalin modulation of neurotransmitter release is mediated by change in intrinsic activation/inactivation properties of ca(v)2.1 calcium channels

Affiliations
Comparative Study

Pregabalin modulation of neurotransmitter release is mediated by change in intrinsic activation/inactivation properties of ca(v)2.1 calcium channels

Mariano N Di Guilmi et al. J Pharmacol Exp Ther. 2011 Mar.

Abstract

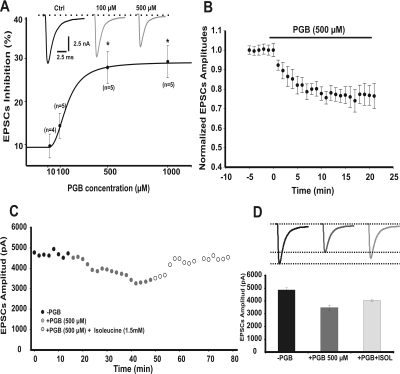
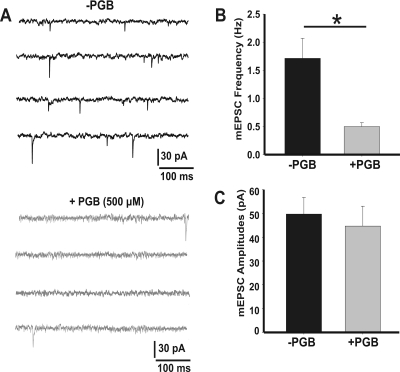
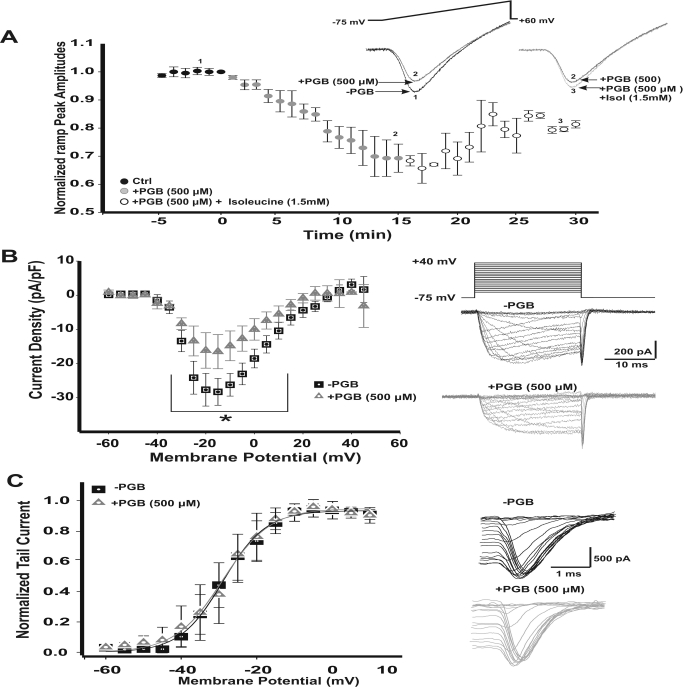
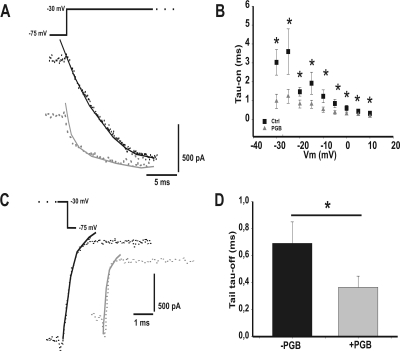
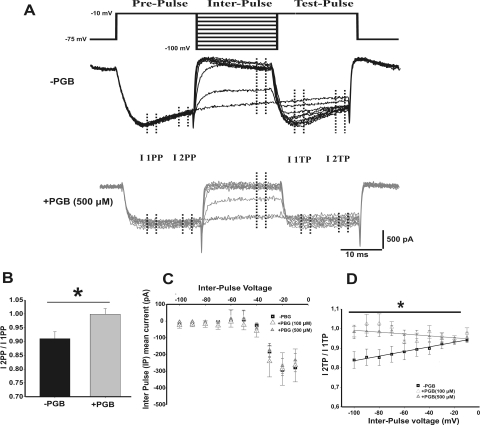
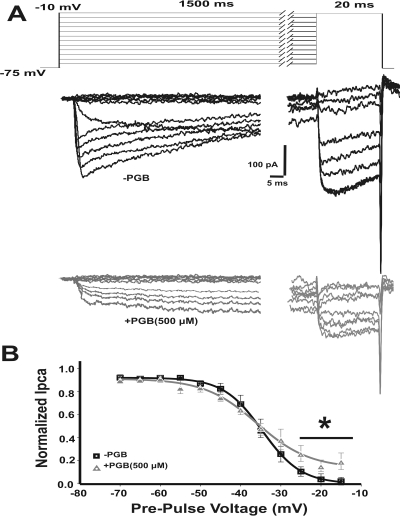
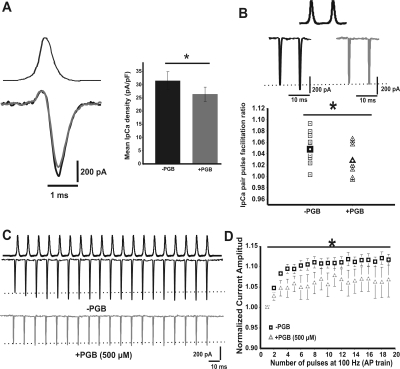
In this work, we studied the effects of the anticonvulsant and analgesic drug pregabalin (PGB) on excitatory postsynaptic currents (EPSCs) at principal neurons of the mouse medial nucleus of the trapezoid body and on presynaptic calcium currents at the calyx of Held. We found that the acute application of PGB reduced the amplitude of EPSCs in a dose-dependent manner with a maximal blocking effect of approximately 30%. A clinical high-concentration dose of PGB (e.g., 500 μM) blocked Ca(v)2.1 channel-mediated currents and decreased their facilitation during a 100-Hz train, without changing their voltage-dependent activation. Furthermore, PGB also removed the inactivation of Ca(v)2.1 channels at a clinically relevant low concentration of 100 μM. These results suggest novel modulatory mechanisms mediated by the acute administration of PGB on fast excitatory synaptic transmission and might contribute to better understanding PGB anticonvulsant/analgesic clinical effects.


Figures

Fig. 1.
Fig. 1.
PGB reduces excitatory postsynaptic currents. A, dose-response relationship fitted to a Hill equation (IC50 = 161.13 μM, Hill slope 2.4663). EPSC amplitudes after the inhibitory effect of PGB at both 500 μM and 1 mM concentrations were statistically different with respect to control conditions (repeated measures ANOVA F2, 16 = 10.60, p < 0.003, Student-Newman-Keuls post hoc test, t < 0.05). Top inset, representative traces of EPSCs in control (Ctrl) conditions and after a 15-min incubation with two different PGB concentrations. B, time plot of EPSC normalized amplitudes from MNTB neurons (−75 mV holding potential) before and during bath perfusion with 500 μM PGB (top black solid bar). Mean EPSC amplitude was reduced by 30 ± 3% (Student's t test, p = 0.024). Note how the EPSC maximum inhibition reached a steady-state value after 10 min of PGB bath application. C, EPSC amplitudes in the absence (black circles) or in the presence of PGB (500 μM, gray circles) and after l-isoleucine application (1.5 mM, open gray circles). D, the PGB effect was partially rescued (up to 10%) by l-isoleucine. Values are presented as means ± S.E.M.
Fig. 2.
Fig. 2.
Frequencies, but not amplitudes, of spontaneous EPSCs are reduced by PGB. A, representative traces of mEPSPs (in the presence of 1 μM TTX) in the absence (top) or presence (bottom) of 500 μM PGB. B and C, mean mEPSC frequencies and amplitudes, respectively. mEPSPs were recorded during 3 min. Mean amplitudes were 39 ± 2 pA in −PGB (n = 11) and 38 ± 2 pA in +PGB (n = 10), whereas frequencies were 1.7 ± 0.4 and 0.5 ± 0.1 Hz, respectively (*, Student's t test, p = 0.004). Values are presented as mean ± S.E.M.
Fig. 3.
Fig. 3.
Acute reduction of presynaptic calcium currents (IpCa) by PGB. A, peak current amplitudes observed for 50-ms depolarizing voltage ramps either after bath perfusion with 500 μM PGB (filled gray circles, n = 7) or with the combination of PGB + 1.5 mM isoleucine (Isol; open gray circles, n = 3). PGB reduced calcium currents (IpCa) by 30%, whereas in the presence of PGB + isoleucine, IpCa recovered 10% above control amplitudes. Stimulus ramp protocols with their representative IpCa are shown in the right inset. Numbers from 1 to 3 indicate the specific time points of the representative traces illustrated. B, current density-voltage relationships for IpCa before (−PGB) and after a 15-min bath perfusion with PGB (+PGB). The IpCa started activating at −35 mV with an apparent reversal potential at +40 mV. Peak inward current density was reached at −15 mV with mean values of −28.3 ± 3.9 pA/pF for −PGB and −16.5 ± 5.0 pA/pF for +PGB (*, repeated measures ANOVA, F2, 214 = 19.594, p < 0.001, Student-Newman-Keuls post hoc test, t < 0.01). Stimulus waveform for the I-V protocol (holding potential −75 mV, voltage square pulses ranging from −60 to +50 mV, 5-mV steps, 20-ms duration) is shown together with representative recordings of IpCa -PGB (top, black) and +PGB (bottom, gray). Current amplitudes are the mean during the last 5 ms of the recordings for each potential. C, IpCa activation curves, obtained from tail currents (see representative tails currents shown in right panels). Activation curves were fitted using a Boltzmann equation. IpCa activated at the same voltages at both conditions. Half-activation voltages (V1/2) were 28.9 ± 0.4 mV for −PGB (n = 11) and 28.3 ± 0.5 mV for +PGB (n = 11, Student's t test, p > 0.05). Slopes (k) were 5.7 ± 0.4 and 5.4 ± 0.4 mV (Student's t test, p > 0.05) for −PGB and +PGB, respectively. Values are presented as means ± S.E.M.
Fig. 4.
Fig. 4.
Effect of PGB (500 μM) on calcium current activation and deactivation time courses. A, representative traces (dotted lines) of IpCa at −30 mV without (black) and with (gray) pregabalin obtained from the I-V protocol. Current traces were fitted (solid line) with a single exponential function. B, IpCa activation time constants (τ-on) plotted against the voltage command step. There are significant differences between −PGB (n = 10) and +PGB (n = 5; 500 μM) all over the voltage range from −30 mV to +10 mV (*, Student's t test, p < 0.05). C, representative traces (dotted lines) of tail currents after repolarizing to −75 mV from a depolarizing pulse at −10 mV without (black) and with (gray) pregabalin, obtained from the I-V protocol. Currents were fitted (solid line) with a single exponential function. D, deactivation time constant at −10 mV (τ-off) obtained from tail current decaying phase is plotted. Significant differences between −PGB (n = 12) and +PGB (n = 4) conditions was found (*, Student's t test, p < 0.05, n = 12). Values are represent as means ± S.E.M.
Fig. 5.
Fig. 5.
PGB eliminates the recovery from inactivation of presynaptic calcium currents, without affecting their voltage-dependent activation. A, inactivation protocol (top) consisting of paired square pulses separated by depolarizing voltage steps (interpulse voltage VIP from −75 to −10 mV, 10-mV increments) and representative calcium currents (bottom) are shown for −PGB (black) and +PGB (500 μM) (gray) conditions. Note how steady-state inactivation during both prepulse and test pulses was reduced by PGB. B, inactivation rate during the prepulse (I2PP/I1PP) was 10% in normal conditions and was largely reduced by PGB bath application. C, mean steady-state current versus interpulse voltage relationship for control (−PGB, squares) and 100 μM (+PGB, open triangles) or 500 μM (+PGB, closed triangles). Note the similarity of curves under the three different conditions (repeated measures ANOVA, p > 0.05). D, inactivation rate during the test pulse (I2TP/I1TP) versus VIP. The slope of the lineal fitting was 9 × 10⁻⁴ ± 3 × 10⁻⁴ mV−1 for −PGB, −6 × 10⁻⁴ ± 3 × 10⁻⁴ mV−1 for +PGB (100 μM) (Student's t test, p = 0.001), and 2 × 10⁻⁴ ± 1 × 10⁻⁴ mV−1 for +PGB (500 μM) (Student's t test, p = 0.025).
Fig. 6.
Fig. 6.
IpCa steady-state inactivation is modulated by PGB. A, stimulation protocol and sample traces of IpCa with (gray) and without (black) PGB, evoked by a 20-ms voltage step to the potential corresponding to the peak of the I-V curve, after conditioning prepulses of 1.5 s to voltages ranging from −75 to −10 mV (10-mV steps). B, steady-state inactivation from presynaptic terminals with or without PGB. Test IpCa are normalized to the maximum peak amplitude evoked after the −60 mV conditioning pulse, plotted against the conditioning voltage and fitted by a Boltzmann distribution function. Half-activation voltage is V1/2 = −34.1 ± 0.9 mV for −PGB (n = 9) and −35.9 ± 1.4 mV for +PGB (n = 6, Student's t test, p > 0.05). The slope factor is significantly lower in the presence of PGB: −4.1 ± 0.2 and −4.8 ± 0.4 mV for −PGB and +PGB, respectively (Student's t test, p = 0.05). Values are presented as means ± S.E.M.
Fig. 7.
Fig. 7.
PGB decreases IpCa facilitation during paired-pulse and high frequency trains of action potentials. A, representative traces of IpCa (left, bottom traces) evoked by a single AP waveform (left, upper trace) recorded at the calyx of Held presynaptic terminals. Mean AP evoked IpCa density (right) is 31.5 ± 3.4 pA/pF for −PGB and 26.4 ± 2.7 pA/pF for +PGB (500 μM). IpCa density decreased 14 ± 5% in the presence of PGB (paired Student's t test, p = 0.006, n = 14). B, representative paired IpCa traces evoked by paired action potentials (at 100 Hz) recorded in current clamp configuration (top), in both the absence (middle left, black traces), and presence of PGB (500 μM, middle right gray traces). Plot of IpCa ratios (bottom) in −PGB (squares, mean 1.05 ± 0.01) and +PGB (triangles, mean 1.03 ± 0.01, Student's t test, p = 0.03). C, representative IpCa traces generated by 100-Hz trains of APs before (top) or after (bottom) PGB bath application. D, normalized current amplitudes during 100 Hz. train of APs. IpCa facilitation observed in the absence of PGB (maximum at 112 ± 2%, n = 15) was attenuated in the presence of 500 μM PGB (106 ± 4% after the third shock, n = 9; repeated measures ANOVA, F2, 284 = 36.99, p < 0.001, Student-Newman-Keuls post hoc test, t < 0.001).

References

    1. Bayer K, Ahmadi S, Zeilhofer HU. (2004) Gabapentin may inhibit synaptic transmission in the mouse spinal cord dorsal horn through a preferential block of P/Q-type Ca2+ channels. Neuropharmacology 46:743–749 - PubMed
    1. Belliotti TR, Capiris T, Ekhato IV, Kinsora JJ, Field MJ, Heffner TG, Meltzer LT, Schwarz JB, Taylor CP, Thorpe AJ, et al. (2005) Structure-activity relationships of pregabalin and analogues that target the α2-δ protein. J Med Chem 48:2294–2307 - PubMed
    1. Beydoun A, Uthman BM, Kugler AR, Greiner MJ, Knapp LE, Garofalo EA. and Pregabalin 1008–009 Study Group (2005) Safety and efficacy of two pregabalin regimens for add-on treatment of partial epilepsy. Neurology 64:475–480 - PubMed
    1. Blake MG, Boccia MM, Acosta GB, Höcht C, Baratti CM. (2007) Opposite effects of a single versus repeated doses of gabapentin on retention performance of an inhibitory avoidance response in mice. Neurobiol Learn Mem 87:192–200 - PubMed
    1. Borst JG, Sakmann B. (1998) Facilitation of presynaptic calcium currents in the rat brainstem. J Physiol 513 (Pt 1):149–155 - PMC - PubMed

Publication types

MeSH terms

Substances

LinkOut - more resources