. 2011 Feb;21(2):255-64.
doi: 10.1101/gr.113811.110. Epub 2010 Dec 22.

A global analysis of C. elegans trans-splicing

Affiliations

A global analysis of C. elegans trans-splicing

Mary Ann Allen et al. Genome Res. 2011 Feb.

Abstract

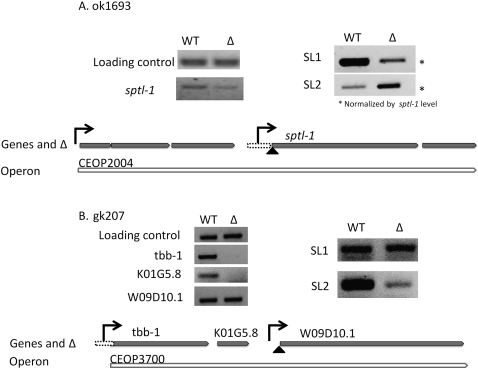
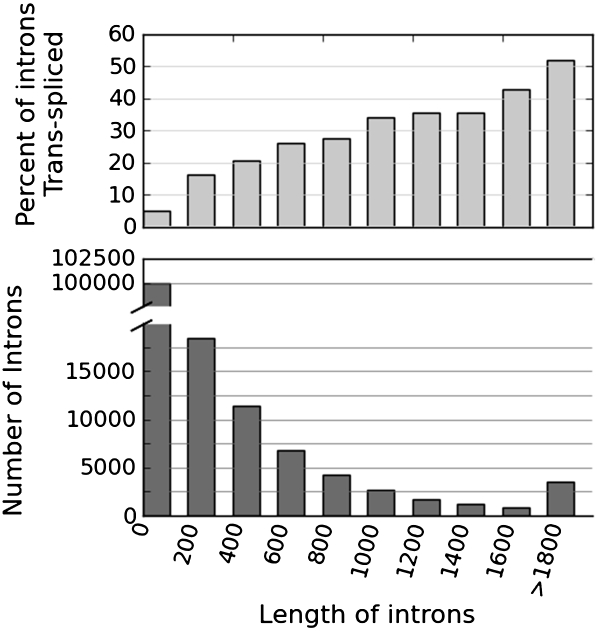
Trans-splicing of one of two short leader RNAs, SL1 or SL2, occurs at the 5' ends of pre-mRNAs of many C. elegans genes. We have exploited RNA-sequencing data from the modENCODE project to analyze the transcriptome of C. elegans for patterns of trans-splicing. Transcripts of ∼70% of genes are trans-spliced, similar to earlier estimates based on analysis of far fewer genes. The mRNAs of most trans-spliced genes are spliced to either SL1 or SL2, but most genes are not trans-spliced to both, indicating that SL1 and SL2 trans-splicing use different underlying mechanisms. SL2 trans-splicing occurs in order to separate the products of genes in operons genome wide. Shorter intercistronic distance is associated with greater use of SL2. Finally, increased use of SL1 trans-splicing to downstream operon genes can indicate the presence of an extra promoter in the intercistronic region, creating what has been termed a "hybrid" operon. Within hybrid operons the presence of the two promoters results in the use of the two SL classes: Transcription that originates at the promoter upstream of another gene creates a polycistronic pre-mRNA that receives SL2, whereas transcription that originates at the internal promoter creates transcripts that receive SL1. Overall, our data demonstrate that >17% of all C. elegans genes are in operons.


Figures

Figure 1.
Figure 1.
The level of trans-splicing in C. elegans. (A) Trans-splice sites were mapped to the 5′ ends of protein-coding genes. For each gene, average expression across all stages in dcpm was used. To guarantee trans-splicing could have been detected if present, cut-offs were used to remove genes with low expression levels. The first row contains all genes. The lower rows contain genes with expression levels higher than the minimal expression level cutoff. The middle column lists the number of genes above the cutoff, and the last column is the percentage of those genes that are trans-spliced. (B) Genes expressed more highly are more likely to be trans-spliced. Genes were divided into bins based on expression level. For each gene, average expression across all stages in dcpm was used. Percentage of genes in each group that are trans-spliced was plotted. The number above each bar indicates the number of genes in the bin.
Figure 2.
Figure 2.
SL1/SL2 trans-splicing ratios at each trans-spliced gene. Histogram showing the number of gene trans-splice sites with indicated SL1:SL2 proportion on the y-axis. The x-axis shows the proportion SL1/SL2 by the opposing triangles and ranges from 100% SL1 to 100% SL2. (A) All genes; (B) non-operon genes; (C) first genes in operons; (D) downstream genes in operons.
Figure 3.
Figure 3.
SL2 trans-splicing as a function of distance between genes. Distance between the polyadenylation site of the upstream gene and the trans-splice site of the downstream gene (y-axis) vs. the SL2% of the downstream gene. Box and whiskers plot in which the top of the box equals the first quartile and the bottom is the third quartile. The median value is denoted by a line within the box. The whiskers are 1.5× the inner quartile range. Outliers are represented by ×. All three panels show the same data with progressive magnifications of the lower ranges. The top panel shows all values. The numbers above the top panel are the numbers of genes in each category. The dotted line denotes the maximum value of the middle panel, in which only values below 10,000 are plotted. Similarly, the bottom shows only values below 1000. On the right, the data for all downstream operon genes are shown.
Figure 4.
Figure 4.
ICR length vs. gene length. (A) Histogram of all ICRs shows that most ICRs are <200 nt long. ICR length is in bins of 50 nt. Number of ICRs with the indicated length is shown on the y-axis. (B) Box-and-whiskers plot of average intron length of the genes upstream and downstream of the ICR vs. the ICR length. The number of genes in each category is indicated by numbers above the graph. ICR lengths are in bins of 200 nt.
Figure 5.
Figure 5.
Relationship between trans-splicing specificity and proximal promoters. (Bottom) Histogram of the total number of genes with indicated SL1/SL2 proportion. (Top) The percent of those genes associated with a peak of the minor histone HTZ, which marks promoters (Whittle et al. 2008). (A) Genes with low percent SL2 (high SL1) are more likely to be in an HTZ peak than genes with high SL2. Trans-splices sites with mixed SL are the category most likely to be in an HTZ peak. (B) When genes with <500-bp intercistronic distance are analyzed, those with high SL1 are even more likely to be in an HTZ peak. Dotted line indicates the percent of all genes with an HTZ peak (Whittle et al. 2008).
Figure 6.
Figure 6.
Effect of promoter deletions on the SL1/SL2 ratio. Diagrams at the bottom of each panel are to scale. They show pointed gray rectangles to indicate genes, hollow pointed empty rectangles to indicate operons and dotted boxes to indicate deletions. Black arrows indicate predicted locations of promoters and the triangle indicates the trans-splice site analyzed by RT-PCR. (A) RT-PCR in wild type (WT) and ok1693 (Δ). To make visualization of SL1/SL2 ratio easier, sptl-1 levels have been normalized to wild-type by adding 4× cDNA of the deletion strain based on the levels of mRNA for this gene (data not shown). (B) RT-PCR in wild type (WT) and gk207 (Δ). (Left) RT-PCR of mature mRNAs. (Right) RT-PCR of W09D10.1 trans-spliced to SL1 and SL2. The same level of cDNA was used for all PCRs.
Figure 7.
Figure 7.
Rare trans-splicing at intron 3′ splice sites vs. intron length. Sites at which some trans-splicing occurred were mapped to annotated intron 3′ splice sites. Introns were divided into bins of 200 nt according to their length, with the number indicating the lower end of the bin. The bottom graph shows the number of introns in the genome with the indicated length, and the top graph shows the percent of the introns in each bin that have at least one associated trans-splicing event.

References

    1. Beißbarth T, Speed TP 2004. GOstat: Find statistically overrepresented Gene Ontologies within a group of genes. Bioinformatics 20: 1464–1465 - PubMed
    1. Blumenthal T 2005. Trans-splicing and operons. WormBook 25: 1–9 - PubMed
    1. Blumenthal T, Spieth J 1996. Gene structure and organization in Caenorhabditis elegans. Curr Opin Genet Dev 6: 692–698 - PubMed
    1. Blumenthal T, Steward K 1997. Trans-splicing. In C. elegans II, pp. 129–132 Cold Spring Harbor Laboratory Press, Cold Spring Harbor, NY
    1. Celniker SE, Dillon LA, Gerstein MB, Gunsalus KC, Henikoff S, Karpen GH, Kellis M, Lai EC, Lieb JD, MacAlpine DM, et al. 2009. Unlocking the secrets of the genome. Nature 459: 927–930 - PMC - PubMed

Publication types

LinkOut - more resources