. 2011 Feb;21(2):182-92.
doi: 10.1101/gr.112466.110. Epub 2010 Dec 22.

Genome-wide analysis of promoter architecture in Drosophila melanogaster

Affiliations

Genome-wide analysis of promoter architecture in Drosophila melanogaster

Roger A Hoskins et al. Genome Res. 2011 Feb.

Abstract

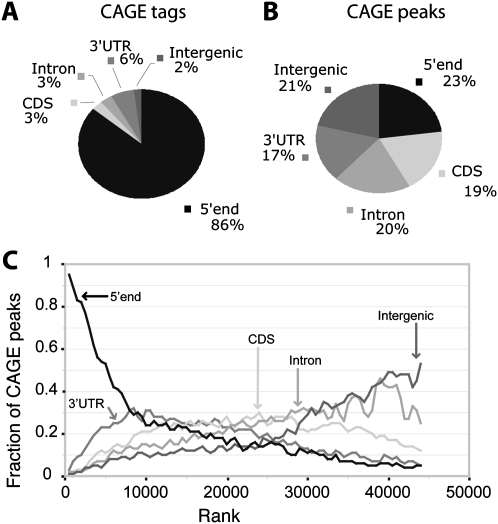
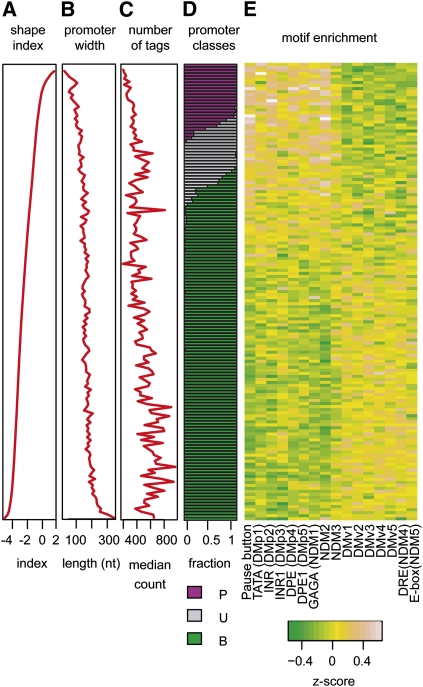
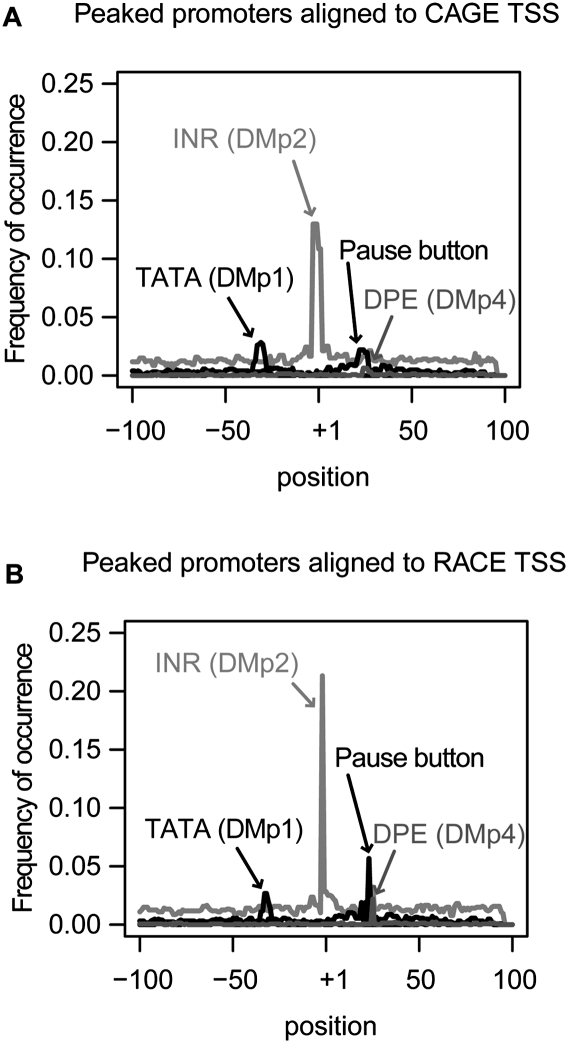
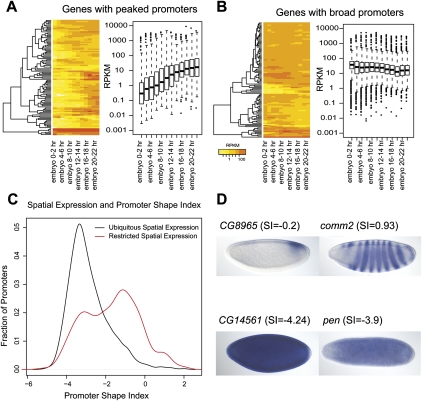
Core promoters are critical regions for gene regulation in higher eukaryotes. However, the boundaries of promoter regions, the relative rates of initiation at the transcription start sites (TSSs) distributed within them, and the functional significance of promoter architecture remain poorly understood. We produced a high-resolution map of promoters active in the Drosophila melanogaster embryo by integrating data from three independent and complementary methods: 21 million cap analysis of gene expression (CAGE) tags, 1.2 million RNA ligase mediated rapid amplification of cDNA ends (RLM-RACE) reads, and 50,000 cap-trapped expressed sequence tags (ESTs). We defined 12,454 promoters of 8037 genes. Our analysis indicates that, due to non-promoter-associated RNA background signal, previous studies have likely overestimated the number of promoter-associated CAGE clusters by fivefold. We show that TSS distributions form a complex continuum of shapes, and that promoters active in the embryo and adult have highly similar shapes in 95% of cases. This suggests that these distributions are generally determined by static elements such as local DNA sequence and are not modulated by dynamic signals such as histone modifications. Transcription factor binding motifs are differentially enriched as a function of promoter shape, and peaked promoter shape is correlated with both temporal and spatial regulation of gene expression. Our results contribute to the emerging view that core promoters are functionally diverse and control patterning of gene expression in Drosophila and mammals.


Figures

Figure 1.
Figure 1.
Intersection of CAGE data with gene annotations. (A) The fractions of total CAGE tags that overlap annotated features. (B) The fractions of CAGE peaks that overlap annotated features. (C) CAGE peaks are ordered by tag count from highest to lowest. For bins of 1000 CAGE peaks, the fractions of peaks that overlap five classes of annotated features are plotted. The CAGE peaks toward the top of the rank list primarily overlap 5′ UTRs, while peaks at the bottom of the rank list tend to be intergenic. At the bottom of the rank list, the fractions of overlap approach expectation as computed by the GSC statistics package.
Figure 2.
Figure 2.
RLM-RACE analysis of the l(3)neo38 gene. RACE primers were designed to target three transcript isoforms of the gene. Three promoters (P1, P6, P7) correspond to annotated start sites for the –RA, –RB, and –RC isoforms, respectively. Four promoters (P2–P5) are new.
Figure 3.
Figure 3.
Integration of RE EST, CAGE, and RACE data and classification of promoter shape. TSS distributions within nine promoter regions are ordered by increasing shape index (SI): (A–C) peaked promoters, (D–F) unclassified promoters, and (G–I) broad promoters. For each promoter, the RE EST, CAGE, RACE, and composite TSS distributions are shown. SI values of the composite distributions and gene associations are indicated.
Figure 4.
Figure 4.
Comparison of promoter regions and TSS distributions determined by RE EST, CAGE, and RACE data. (A) The numbers of clusters in overlapping subsets of CAGE peaks, RACE clusters, and RE EST clusters are indicated. Validated promoters (V) are defined by at least two of the three assays; supported promoters (S) are defined by one assay only but overlap an annotated promoter or 5′ UTR; unsupported CAGE-only (C) and RACE-only (R) clusters do not overlap annotated promoters or 5′ UTRs. (B) The relative offsets of TSS locations by pairwise comparisons of the three assays. The mean pairwise offset is 1.7 nt.
Figure 5.
Figure 5.
Promoter architecture of the Drosophila embryo. Promoters are ordered by shape index, and each row corresponds to the average of a bin of 50 promoters. Shape index (A), promoter width (B), and number of tags per promoter (C) are plotted. (D) Promoter classification into peaked (P, purple), unclassified (U, gray), and broad (B, green) are indicated. (E) Core promoter motifs are differentially enriched between peaked and broad promoters.
Figure 6.
Figure 6.
Comparison of the CAGE and RACE assays by motif analysis in peaked promoters. Motif occurrence frequencies of positionally enriched motifs are plotted. The most abundant TSS within a promoter was used to define position +1. (A) Motif positions in peaked promoters relative to the most abundant TSS defined by CAGE. (B) Motif positions in peaked promoters relative to the most abundant TSS defined by RACE.
Figure 7.
Figure 7.
Correlation of temporal and spatial gene expression patterns with peaked and broad promoters. (A) Temporal expression profiles of 100 genes whose promoters have the highest SI scores (peaked promoters) are highly variable across a time course of embryonic development, with reads per kilobase per million (RPKM) values fluctuating between <1 (yellow) and >100 (red). The average RPKM value among these genes with peaked promoter is 0.3 at the 0–2-h time point and gradually increases to 10 at the 22–24-h time point. Expression profiles of genes with peaked promoters were also highly variable in the time course, ranging over an order of magnitude between the first and third quartiles (box plots). (B) Temporal expression profiles of 100 genes whose promoters have the lowest SI scores (broad promoters). The average RPKM is 60 across all time points. The first and third quartile RPKMs of genes with broad promoters were within one order of magnitude of the average RPKM, or between 10 and 80 across all time points. (C) Distribution of the shape index (SI) for spatially restricted genes (red) and ubiquitously expressed genes (black). (D) Representative embryonic gene expression patterns in whole-mount embryos, stages 4–5, restricted (upper two panels) and ubiquitous (lower two panels).

References

    1. Adams MD, Celniker SE, Holt RA, Evans CA, Gocayne JD, Amanatides PG, Scherer SE, Li PW, Hoskins RA, Galle RF, et al. 2000. The genome sequence of Drosophila melanogaster. Science 287: 2185–2195 - PubMed
    1. Affymetrix/Cold Spring Harbor Laboratory ENCODE Transcriptome Project 2009. Post-transcriptional processing generates a diversity of 5′-modified long and short RNAs. Nature 457: 1028–1032 - PMC - PubMed
    1. Altschul SF, Madden TL, Schaffer AA, Zhang J, Zhang Z, Miller W, Lipman DJ 1997. Gapped BLAST and PSI-BLAST: A new generation of protein database search programs. Nucleic Acids Res 25: 3389–3402 - PMC - PubMed
    1. Balwierz PJ, Carninci P, Daub CO, Kawai J, Hayashizaki Y, Van Belle W, Beisel C, van Nimwegen E 2009. Methods for analyzing deep sequencing expression data: Constructing the human and mouse promoterome with deepCAGE data. Genome Biol 10: R79 doi: 10.1186/gb-2009-10-7-r79 - PMC - PubMed
    1. Bickel PJ, Brown JB, Boley N, Huang H, Zhang N 2011. Non parametric methods for genomic inference. Ann Appl Stat (in press)

Publication types

MeSH terms

Substances