. 2011 Feb;21(2):265-75.
doi: 10.1101/gr.108845.110. Epub 2010 Dec 22.

Multimodal RNA-seq using single-strand, double-strand, and CircLigase-based capture yields a refined and extended description of the C. elegans transcriptome

Affiliations

Multimodal RNA-seq using single-strand, double-strand, and CircLigase-based capture yields a refined and extended description of the C. elegans transcriptome

Ayelet T Lamm et al. Genome Res. 2011 Feb.

Abstract

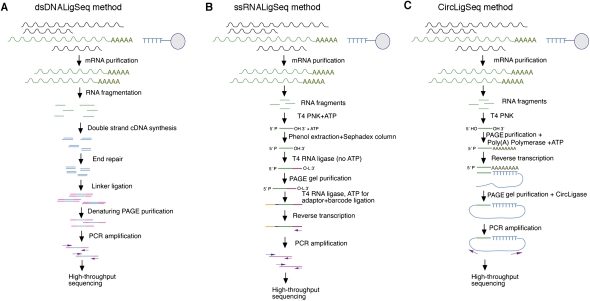
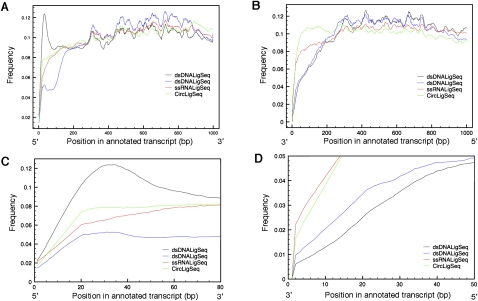
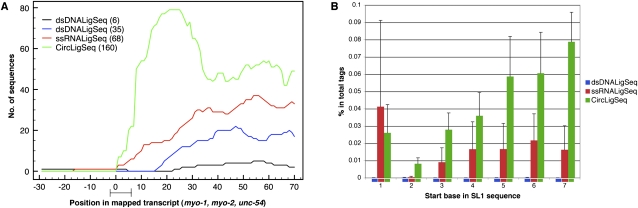
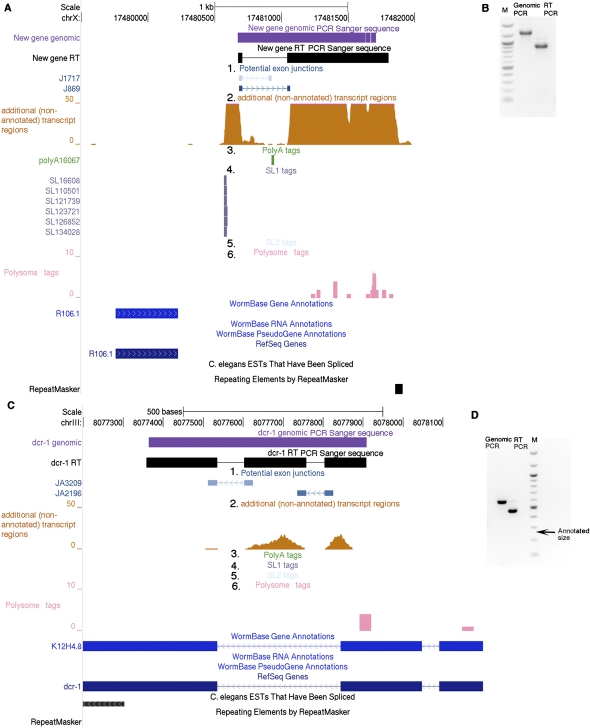
We have used a combination of three high-throughput RNA capture and sequencing methods to refine and augment the transcriptome map of a well-studied genetic model, Caenorhabditis elegans. The three methods include a standard (non-directional) library preparation protocol relying on cDNA priming and foldback that has been used in several previous studies for transcriptome characterization in this species, and two directional protocols, one involving direct capture of single-stranded RNA fragments and one involving circular-template PCR (CircLigase). We find that each RNA-seq approach shows specific limitations and biases, with the application of multiple methods providing a more complete map than was obtained from any single method. Of particular note in the analysis were substantial advantages of CircLigase-based and ssRNA-based capture for defining sequences and structures of the precise 5' ends (which were lost using the double-strand cDNA capture method). Of the three methods, ssRNA capture was most effective in defining sequences to the poly(A) junction. Using data sets from a spectrum of C. elegans strains and stages and the UCSC Genome Browser, we provide a series of tools, which facilitate rapid visualization and assignment of gene structures.


Figures

Figure 1.
Figure 1.
Flowcharts describing the RNA-seq methods. Flowcharts describing the protocols to construct mRNA sequencing libraries using the dsDNALigSeq RNA-seq method (A), ssRNALigSeq RNA-seq method (B), or CircLigSeq RNA-seq method (C).
Figure 2.
Figure 2.
Transcript coverage by position by variety of RNA-seq methods. Transcript coverage was determined by comparing transcript position of RNA-seq tags generated by the dsDNALigSeq, ssRNALigSeq, and CircLigSeq methods. The sequence tags were mapped using BLAT software. Only transcripts that are longer then 1000 bp were considered in the analysis. The plots depict transcript coverage from the start of the transcript (A,C) or from the end of the transcript (B,D). C and D are magnified representations of A and B, respectively. For clarity, only RNA-seqs from N2 mixed stage constructed by the ssRNALigSeq method (red), fem-1(hc17) constructed by dsDNALigSeq method (black), N2 at L4 larval stage constructed by dsDNALigSeq method (blue), or N2 at L1 larval stage constructed by CircLigSeq method (green) are shown. The somewhat uneven coverage along the length of a canonical gene appears partly due to disproportionate contributions by a fraction of highly expressed genes.
Figure 3.
Figure 3.
Coverage at the 5′ region of genes changes significantly among the different RNA-seq methods. (A) Transcript coverage on the 5′ region was determined by mapping sequences generated by the three different RNA-seq methods to the well-annotated start sites of the myo-1, myo-2, and unc-54 genes (Dibb et al. 1989; Okkema et al. 1993). The sequence tags were mapped using BLAT software. The plots depict transcript coverage from 30 bases before the annotated start sites to 70 bases after. The bar on the x-axis presents the 1–5 base ambiguity and variation in natural start sites (Dibb et al. 1989; Okkema et al. 1993). For clarity, only RNA-seqs from N2 mixed stage constructed by the ssRNALigSeq method (red), fem-1(hc17) constructed by dsDNALigSeq method (black), N2 at L4 larval stage constructed by the dsDNALigSeq method (blue), or N2 at L1 larval stage constructed by the CircLigSeq method (green) are shown. The overall number of sequences that aligned to the assayed region are indicated in parentheses. A lack of coverage at the extreme 5′ ends was also observed using data that were derived from a similar dsDNALigSeq method by Hillier et al. (2009) (Supplemental Fig. 7S). (B) Frequency of sequence reads starting in SL1 splice leader sequences. A start frequency at each of the first seven bases of SL1 was calculated for the three RNA-seq methods by counting the portion of the sequence tags that start with the relevant 16 SL1 bases. None of these 16-mers is found in the C. elegans transcriptome outside of SL1. (Blue) dsDNALigSeq method; (red) ssRNALigSeq method; (green) CircLigSeq method.
Figure 4.
Figure 4.
Browser-based refinement of the transcriptome by RNA-seq. We used the UCSC Genome Browser custom tracks with the WS190 version of the C. elegans genome for viewing the following data sets: (1) “Potential exon-junctions” track (blue), which displays potential nonannotated exon–exon junctions that are supported by RNA-seq reads by two bars, each for the 23 bp of the adjacent exons, with a connecting arrow that indicates the exon-junction directionality. The bar shade indicates a strength score, calculated from the number of aligned tags to the exon junction and number of bases from each junction that are included in the sequence tag, with darker shades representing higher scores (score = 100 × number of alignments × coverage score). The coverage score equals 1 when the smallest base coverage of the exon is 9 or 10 bases; 1.2 when the smallest base coverage of exon is 11, 12, or 13; or 1.5 when the smallest base coverage of exon is 14, 15, or 16. (Supplemental Fig. S2). (2) RNA sequences from regions with no existing gene predictions [“additional (nonannotated) transcript regions,” orange]. In this custom track the bar height represents the number of sequences that align to each position. (3) A poly(A) tags track (green) that displays polyadenylation junctions identified by the RNA-seq. The arrow in each bar points to the start position of the putative poly(A) tail. (4) SL1 tags track (purple) and (5) SL2 tags track (blue-gray) that display trans-splice leader sites identified by the RNA-seq. The arrow in each bar indicates splice leader directionality. (6) A polysome tags track (pink) that displays observed tags from a polysome-enriched RNA pool. The browser shots exemplify the discovery of nonannotated transcribed regions from RNA-seq data. For chrX:17480500–17842000 (A) nonannotated genomic tags with a darkly shaded splice junction suggest a transcript. This transcript and splice were validated by RT-PCR and sequencing (B; PCR Sanger-sequence data not shown). The SL1 tags suggest the presence of a different transcript from the proximate R106.1 transcript. Polysome sedimentation (pink track in A) suggests that the transcript is present in polysome fractions. The light-shade exon junction and the poly(A) site do not have significant nonannotated genomic tag coverage at the same position, so this junction could be considered “provisional.” dcr-1 is an example of a gene that is studied by many research groups (e.g., Knight and Bass 2001; Duchaine et al. 2006; Pavelec et al. 2009), which we found to contain a predicted nonannotated exon. The exon is 195 bp long and is in-frame with the adjacent exon. This exon appears uniformly incorporated into the transcript; we see no evidence for differential splicing (C). The exon existence was confirmed by PCR, RT-PCR, and Sanger sequencing (D). The arrow in D indicates the size of the expected RT-PCR band from the WS190-annotated dcr-1. EST additions to GenBank (June 2010) further support the structures shown in this figure and Supplemental Figure 4SA.

References

    1. Ambros V, Lee RC, Lavanway A, Williams PT, Jewell D 2003. MicroRNAs and other tiny endogenous RNAs in C. elegans. Curr Biol 13: 807–818 - PubMed
    1. Barton MK, Schedl TB, Kimble J 1987. Gain-of-function mutations of fem-3, a sex-determination gene in Caenorhabditis elegans. Genetics 115: 107–119 - PMC - PubMed
    1. Blekhman R, Marioni JC, Zumbo P, Stephens M, Gilad Y 2010. Sex-specific and lineage-specific alternative splicing in primates. Genome Res 20: 180–189 - PMC - PubMed
    1. Blumenthal T 2004. Operons in eukaryotes. Brief Funct Genomics Proteomics 3: 199–211 - PubMed
    1. Blumenthal T, Steward K 1997. RNA processing and gene structure.In C. elegans II (ed. Riddle TL et al.), pp. 117–145 Cold Spring Harbor Laboratory Press, Cold Spring Harbor, NY - PubMed

Publication types

Associated data