. 2011 Feb;21(2):342-8.
doi: 10.1101/gr.114645.110. Epub 2010 Dec 22.

Genome-wide analysis of alternative splicing in Caenorhabditis elegans

Affiliations

Genome-wide analysis of alternative splicing in Caenorhabditis elegans

Arun K Ramani et al. Genome Res. 2011 Feb.

Abstract

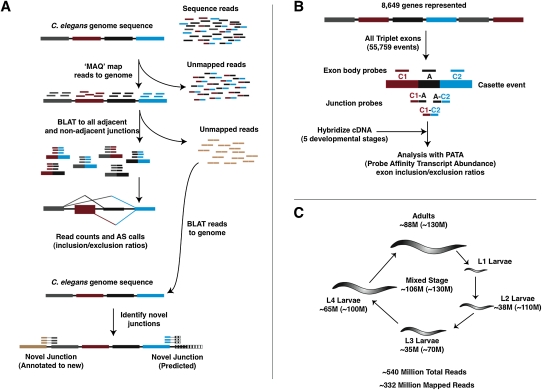
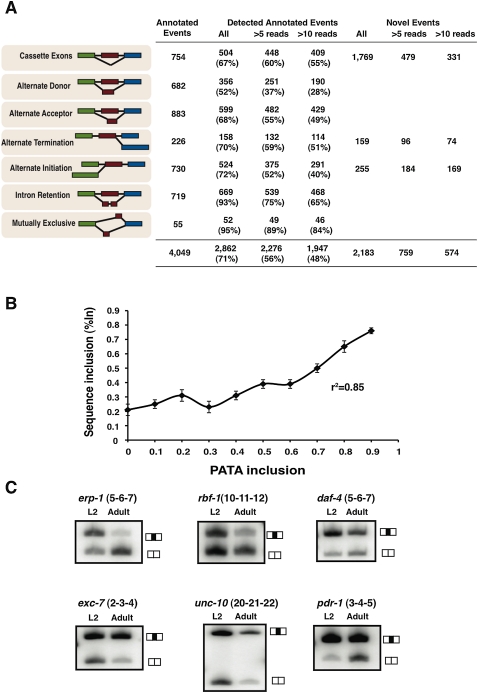
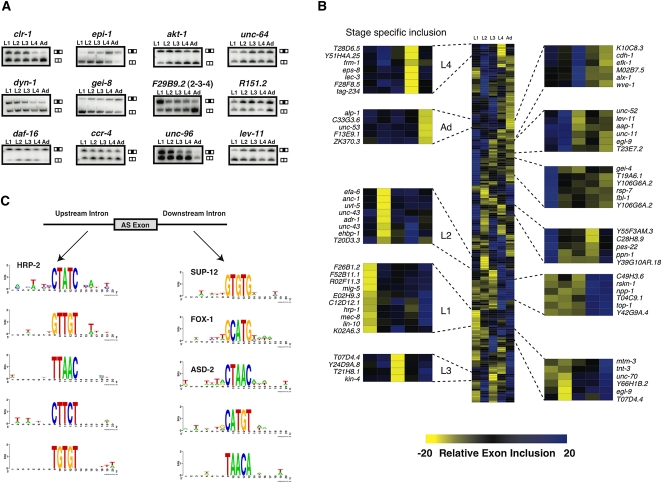
Alternative splicing (AS) plays a crucial role in the diversification of gene function and regulation. Consequently, the systematic identification and characterization of temporally regulated splice variants is of critical importance to understanding animal development. We have used high-throughput RNA sequencing and microarray profiling to analyze AS in C. elegans across various stages of development. This analysis identified thousands of novel splicing events, including hundreds of developmentally regulated AS events. To make these data easily accessible and informative, we constructed the C. elegans Splice Browser, a web resource in which researchers can mine AS events of interest and retrieve information about their relative levels and regulation across development. The data presented in this study, along with the Splice Browser, provide the most comprehensive set of annotated splice variants in C. elegans to date, and are therefore expected to facilitate focused, high resolution in vivo functional assays of AS function.


Figures

Figure 1.
Figure 1.
Outline of RNA-seq and microarray approaches for profiling AS in C. elegans. (A) For RNA-seq analysis, short sequence reads from the transcriptomes of animals isolated at multiple or specific developmental stages are first aligned to the genome and those that uniquely map in their entirety are used to identify exonic regions of transcripts. The remaining unmapped reads are then mapped against an exon junction database containing all possible combinations of splice junctions between annotated exons to identify and quantitatively measure AS events. Finally, any remaining unmapped reads are aligned to novel splice junctions that are not annotated or predicted. (B) Our microarray platform uses exon body (labeled C1, A, and C2 in diagram) and exon junction (labeled C1:A, A:C2, and C1:C2) probes to monitor cassette-type AS events, where the internal exon in a triplet of exons can be skipped in spliced mRNAs. We have included probes to monitor a total of 55,759 exon triplets in 8649 genes (∼50% of annotated genes), in addition to a set of 499 previously annotated cassette AS events. Probe sets corresponding to exon triplets with evidence of AS by our RNA-seq analysis are then combined with the PATA algorithm to generate quantitative predictions of relative isoform usage across the developmental stages analyzed. (C) Number of sequence reads uniquely mapping to the C. elegans genome by stage and sample. The values in parentheses indicate the total number of reads generated for each sample.
Figure 2.
Figure 2.
Identification of known and novel AS events. (A) Table displaying the proportion of different classes of AS events annotated in WormBase that are identified by our RNA-seq analysis with varying degrees of junction count support. Also listed in the last three columns are the number of unannotated AS events identified by our analysis and the number of reads supporting these splice junctions. (B) We compared the %In values for a set of 317 annotated cassette AS events from the true positive set that were detected both by RNA-seq analysis and by our microarray platform. For these AS events, RNA-seq derived %In values profiled across four developmental stages (L2, L3, L4, and adults) were compared to the PATA derived %In values in the same stage. The plot shows a high correlation between the two platforms indicating that both methods are reliable estimates of relative isoform usage. (C) RT-PCR validation of a subset of unannotated AS events in the larval (L2) and adult developmental stages. Primers were designed to anneal to sequences corresponding to neighboring constitutively spliced exons, amplifying two products: one representing isoforms including the alternative exon in transcripts (top bands in gel images) and the other one skipping the alternative exon (bottom bands).
Figure 3.
Figure 3.
Identification of temporally regulated AS events. (A) Semiquantitative RT-PCR validation for a subset of regulated AS events across larvae (L1, L2, L3, and L4) to adult (Ad) stages. Primers were designed to amplify both isoforms, and in each case, the two possible isoforms (top bands, included isoform; bottom bands, excluded isoform) show changes in relative intensities across developmental stages. (B) AS exons that were identified to undergo temporal regulation across development of at least 20% were median centered and hierarchically clustered and visualized using Cluster and TreeView (Eisen et al. 1998). Blue boxes indicate higher exon inclusion, while yellow boxes indicate higher exon exclusion. We find exons that are excluded in specific stages (projected panels to the left) while we also notice shared patterns of relative exon inclusion between multiple stages for other subsets of AS events (projected panels to the right). (C) SeedSearcher was used to identify pentamer motifs that are statistically enriched in either the 50 nt upstream of or downstream from splice junctions that are differentially regulated during development. Examples of these enriched motifs are shown either for motifs located upstream of the AS exon (left) or downstream from the AS exon (right). Note that four of these motifs correspond to the published motifs of HRP-2, SUP-12, FOX-1 and ASD-2, and these are indicated.

References

    1. Barash Y, Bejerano G, Friedman N 2001. A simple hyper-geometric approach for discovering putative transcription factor binding sites. Lect Notes Comput Sci 2149: 278–293
    1. Barberan-Soler S, Zahler AM 2008. Alternative splicing regulation during C. elegans development: Splicing factors as regulated targets. PLoS Genet 4: e1000001 doi: 10.1371/journal.pgen.1000001 - PMC - PubMed
    1. Blencowe BJ 2006. Alternative splicing: New insights from global analyses. Cell 126: 37–47 - PubMed
    1. Brenner S 1974. The genetics of Caenorhabditis elegans. Genetics 77: 71–94 - PMC - PubMed
    1. Calarco JA, Superina S, O'Hanlon D, Gabut M, Raj B, Pan Q, Skalska U, Clarke L, Gelinas D, van der Kooy D, et al. 2009. Regulation of vertebrate nervous system alternative splicing and development by an SR-related protein. Cell 138: 898–910 - PubMed

Publication types

Associated data