. 2011 Feb;21(2):147-63.
doi: 10.1101/gr.110098.110. Epub 2010 Dec 22.

Plasticity in patterns of histone modifications and chromosomal proteins in Drosophila heterochromatin

Affiliations

Plasticity in patterns of histone modifications and chromosomal proteins in Drosophila heterochromatin

Nicole C Riddle et al. Genome Res. 2011 Feb.

Abstract

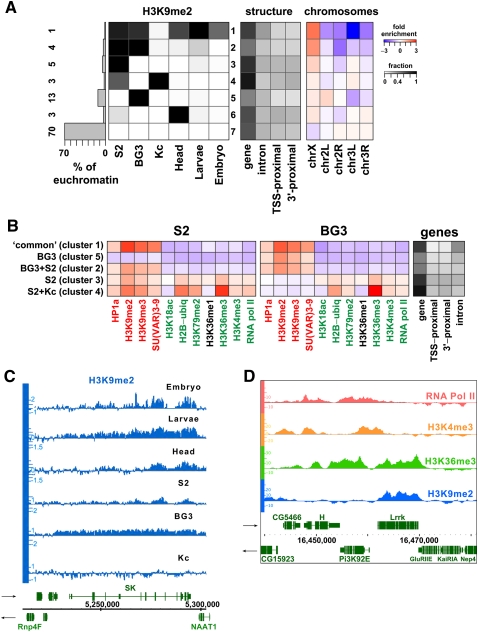
Eukaryotic genomes are packaged in two basic forms, euchromatin and heterochromatin. We have examined the composition and organization of Drosophila melanogaster heterochromatin in different cell types using ChIP-array analysis of histone modifications and chromosomal proteins. As anticipated, the pericentric heterochromatin and chromosome 4 are on average enriched for the "silencing" marks H3K9me2, H3K9me3, HP1a, and SU(VAR)3-9, and are generally depleted for marks associated with active transcription. The locations of the euchromatin-heterochromatin borders identified by these marks are similar in animal tissues and most cell lines, although the amount of heterochromatin is variable in some cell lines. Combinatorial analysis of chromatin patterns reveals distinct profiles for euchromatin, pericentric heterochromatin, and the 4th chromosome. Both silent and active protein-coding genes in heterochromatin display complex patterns of chromosomal proteins and histone modifications; a majority of the active genes exhibit both "activation" marks (e.g., H3K4me3 and H3K36me3) and "silencing" marks (e.g., H3K9me2 and HP1a). The hallmark of active genes in heterochromatic domains appears to be a loss of H3K9 methylation at the transcription start site. We also observe complex epigenomic profiles of intergenic regions, repeated transposable element (TE) sequences, and genes in the heterochromatic extensions. An unexpectedly large fraction of sequences in the euchromatic chromosome arms exhibits a heterochromatic chromatin signature, which differs in size, position, and impact on gene expression among cell types. We conclude that patterns of heterochromatin/euchromatin packaging show greater complexity and plasticity than anticipated. This comprehensive analysis provides a foundation for future studies of gene activity and chromosomal functions that are influenced by or dependent upon heterochromatin.


Figures

Figure 1.
Figure 1.
Chromatin marks define heterochromatin and euchromatin. (A) Diagram of the heterochromatic and euchromatic regions in the D. melanogaster genome. For each chromosome, euchromatin is represented in black, heterochromatin in light blue or light gray, and “C” is the centromere. The targets of this analysis, the assembled heterochromatic sequences in Release 5 of the D. melanogaster genome (h and Het regions), are indicated in light blue. (B) Euchromatin and heterochromatin occupy distinct genomic compartments. Polytene chromosomes from third instar larvae of Oregon R (wild type) (top) or interphase nuclei of S2 cells (bottom) were stained with antibodies specific for H3K4me2, which is enriched in euchromatic regions of the genome, and for H3K9me2, which is enriched in heterochromatin. (Left to right) Phase image (polytene) or DAPI staining (S2 cells); H3K4me2 staining (red); H3K9me2 (green); merged image of the signals for H3K4me2 (red) and H3K9me2 (green).
Figure 2.
Figure 2.
Chromatin marks define the epigenomic border between heterochromatin and euchromatin. Centromere-proximal euchromatin/heterochromatin borders were delineated based on ChIP-array data. Enrichments for H3K9me2 and H3K4me3 in 2–4-h embryos are shown for the centromere-proximal 3 Mb of chromosomes 2, 3, and X, as well as the distal portion of the 4th chromosome (1.35 Mb). The complete Het regions are shown also for chromosomes 2, 3, and X. Log intensity ratio values (y-axis) are plotted for each mark relative to the chromosomal position (x-axis). Boxes below the bar graph demarcate genomic regions with significant enrichment (0.1% false discovery rate [FDR]). Genes are shown in green below the ChIP-array data with their orientations as indicated by the arrows, and the cytogenomically defined heterochromatin is marked by a blue bar. The blue arrowheads indicate the positions of the epigenomic borders for chromosome arms 2L, 2R, and 3L. Patterns for multiple “silent” and “active” marks on chromosome arms 2R and 3L are shown in Supplemental Figure 1.
Figure 3.
Figure 3.
Heterochromatin–euchromatin borders differ among cell types. (A) H3K9me2 log intensity ratio values (y-axis) in the proximal region of chromosome arm 3L (x-axis, sequence coordinates in base pairs) are shown for 2–4-h embryos, 14–16-h embryos, third instar larvae, and adult heads, and for S2, BG3, Kc, and Clone 8 cells. Boxes below the bar graphs demarcate genomic regions with significant enrichment (0.1% FDR). The cytogenomically defined heterochromatin is shown in blue, and the blue arrowheads indicate the positions of the epigenomic border between euchromatin and heterochromatin. The “Repeat Density” track shows the fraction of each 10-kb window that consists of repeated DNAs, based on RepeatMasker (Release 3.28) (http://www.repeatmasker.org). “Gene coverage” plots the number of genes within 50-kb windows, and individual genes are shown below with their orientations as indicated by the arrows. (B) The barplot summarizes the positions of the epigenomic euchromatin–heterochromatin borders on each chromosome arm in the eight cell types examined. On the x-axis, 0 represents the positions of the cytogenomic borders; minus and plus numbers indicate that the epigenomic border was centromere-proximal or -distal to the cytogenomic border, respectively (in Mb). No enrichments for heterochromatic marks were observed for region 3Rh in any cell type, and for the X chromosome in three cell types (?<–), indicating that the borders lie in more proximal regions that are not in the current assemblies. Sequence coordinates of the epigenomic borders are shown in Table 1.
Figure 4.
Figure 4.
A number of specialized chromatin states characterize the centric heterochromatin and chromosome 4 in BG3 cells. (A) Average levels of enrichment of individual chromatin marks and proteins (panels 1 and 2; green, “active” marks; red, “silent” marks; black, undefined) are shown for euchromatin, pericentric heterochromatin, and chromosome 4. The colors show enrichment (red) or depletion (blue) on a log2 scale after genome-wide normalization (see Methods). There is less depletion of “active” marks on chromosome 4 (e.g., H3K4me2 and H3K27ac) and higher enrichment for H3K36me3, a modification associated with transcript elongation, compared with pericentric heterochromatin. Panel 3 gives the average enrichment for repeats and the RNA-seq signal (Z-score, relative to the array average). The fraction (represented by the gray scale) of the three genome domains associated with genes/gene elements is shown in panel 4 (gene, entire gene; TSS-prox., ±500 bp of the TSS annotated in Flybase; 3'-prox., ±500 bp of the 3'end; intron, within annotated introns). The far-right column indicates the percent of the tiled genome sequence on the oligonucleotide array in each group. See Supplemental Figure 4B for the same analysis of the enrichment patterns in S2 cells. (B) Prevalent combinatorial patterns of chromatin marks within the pericentric heterochromatin (“heterochromatin”) and chromosome 4. Sequences displaying specific combinatorial patterns of “chromatin marks” (panel 1) were first identified by a 15-state K-means PCA cluster analysis (presented in Supplemental Fig. 4A), then combined into five similarity groups (A–E) (see Methods). Other properties, shown in the remaining panels, were then assessed relative to these groups. Each column (panels 1 and 2) indicates average enrichment levels for a given histone modification or protein within the five groups (A–E). The color-coding for each group reflects the predominant patterns of “active” and “silent” marks (see text). Panels 3, 4, and 5 are as described above. The “chromosomes” panel shows the fold over-/under-representation of each group (log2 scale) relative to the amount of heterochromatin in each chromosome arm (h plus Het regions). The next two columns give the percentage of the group found in chromosome 4 (“% in chr4”), and the percentage of chromosome 4 that is accounted for by each group (“% of chr4”). “% in extensions” reports the percentage of each group present in the heterochromatin extensions (Fig. 3B; Table 1). See Supplemental Figure 4, B and C for the same analysis of the chromatin states in S2 cells. (C) An example of the interspersion of different chromatin states in the pericentric region of chromosome 2R. The region shows two transcribed genes (p120ctn and CG17486) within a heterochromatic context. The enrichment profiles of four marks are shown in black (y-axis: log intensity ratio values, x-axis: position on the chromosome), and the groups are illustrated as colored bars on the top. Genes are indicated in green with orientations indicated by the arrows. The upstream promoter regions of each gene are associated with the group D pattern (light-green; low H3K9me2 and me3, depletion of H4 and H1, and moderate HP1a enrichment). The regions immediately downstream from TSSs are associated with group C (dark green) and show enrichment in H3K4me2/3, H2B-ubi, along with low levels of HP1a and even lower levels of H3K9me2/3. The sequences within the body of the genes fall into group B (yellow), with strong enrichment for H3K36me3 along with HP1a and H3K9me2/3. The intergenic regions are associated with the group A pattern (red), showing enrichment only for H3K9me2/3 and HP1a. Group E describes a small group of loci under PC regulation.
Figure 5.
Figure 5.
Genes within heterochromatin have specialized properties. (A) The observed chromatin state of each annotated gene was summarized by calculating average enrichment within the 500-bp regions flanking the 5' and 3' ends, the first and last 500 bp within the gene, and the remaining gene body. Each region is represented by the small rectangles (various shades of red in the diagram). Only nonoverlapping genes are considered in this analysis. Levels of modifications and proteins in each gene segment are indicated by shades of red (enrichment) and blue (depletion) in B–D. (B) Average patterns of enrichment for chromatin marks and proteins (log2 scale) for transcriptionally silent genes in BG3 cells. The second panel shows average G/C nucleotide content, repeat content, RNA-seq level, and gene length for each group of genes. The number of genes within each group is indicated in the last column. Transcriptionally inactive genes within heterochromatin and chromosome 4 are highly enriched for H3K9me2/me3, HP1a, and SU(VAR)3-9 over all gene segments, and depleted for most active marks, in comparison to inactive euchromatic genes. (C) Average patterns of chromatin mark enrichment for transcriptionally active genes in BG3 cells. Genes transcribed within the heterochromatic regions show enrichment for “active” marks at comparable levels to expressed euchromatic genes (e.g., H3K36me3, Pol II, H3K4me2/3, and CHRO (a chromodomain protein associated with interband regions on polytene chromosomes; Gortchakov et al. 2005; Rath et al. 2006). However, enrichment levels were noticeably reduced for some active marks (e.g., H4K16ac, H3K18ac, H3K23ac, and H3K79me1/2) compared with active euchromatic genes. Most importantly, the heterochromatic and 4th chromosome genes also contain high levels of HP1a, H3K9me2, and H3K9me3, which are not observed at active euchromatic genes. Expressed heterochromatic genes are, on average, shorter, and contain fewer intronic repeats compared with silent heterochromatic genes (cf. “length” and “repeats” in B and C). (D) Combinatorial chromatin patterns exhibited by heterochromatic genes. Genes were clustered according to their enrichment summary (A) across multiple histone modifications and chromosomal proteins (columns in panel 1; see Methods). Each row shows the average enrichment pattern of the genes within one of the 10 determined clusters. Cluster numbers are color-coded to indicate chromatin states with similar predominant patterns of “active” and “silent” marks. The last three panels show fold enrichment/depletion of each chromosome within the clusters (log2 scale), percentage of cluster regions in chromosome 4 (% in chr4), and percentage of each cluster present in the heterochromatic extensions (“% in ext.”). (E) TSS enrichment patterns at actively transcribed heterochromatic and 4th chromosome genes. The plots show average enrichment profiles for HP1a (blue), H3K9me2 (orange), H3K9me3 (green), and Pol II (red) around TSSs in BG3 cells (left, clusters 7,8 in D and corresponding clusters in S2 cells (right, Supplemental Fig. 5C, clusters 7,8). Genes with divergent promoters (of <2 kb separation) and overlapping genes were excluded, resulting in analysis of a total of 25 genes for BG3 and 32 genes for S2 cells. Average enrichment levels (log2 scale) are plotted on the y-axis relative to the TSS (0) on the x-axis (bp). The results show significant depletion of silencing marks at the TSS.
Figure 6.
Figure 6.
Chromatin patterns vary for expressed genes and intergenic domains located in different heterochromatin regions. The plots show log2 enrichment (y-axis) for H3K36me3 (red), H3K9me2 (light blue), H3K9me3 (dark blue), and HP1a (green) relative to a scaled metagene and 2-kb flanking regions (x-axis). The dashed horizontal lines show average levels of enrichment within intergenic regions for each modification/protein, using the same color key. (A) Average enrichment profiles for expressed pericentric genes in BG3 cells indicate that the levels of HP1a and H3K9me2/3 are higher in intergenic regions compared with gene bodies, whereas H3K36me3 levels are higher over gene bodies than in intergenic regions. Pericentric genes are located in the regions that are centromere-proximal to the BG3 epigenomic borders, including the cytogenomic heterochromatin plus the BG3 extensions (n = 235). (B) Average enrichment profiles for expressed chromosome 4 genes in BG3 cells show significantly higher levels of HP1a, H3K9me2/3, and H3K36me3 enrichment within gene bodies compared with intergenic region averages (n = 58). (C) Average enrichment profiles genes in S2 cells located (C) within the S2-specific extension regions (between the S2 and BG3 epigenomic borders). Profiles for 60 such genes that are expressed in both S2 and BG3 cells are shown. (D) Average enrichment profiles in S2 cells for expressed genes located within the pericentric heterochromatin defined by the cytogenomic borders (excluding 3Rh; n = 117). In S2 cells, the extensions and cytogenomic heterochromatin have comparable levels of enrichment for all four marks within the intergenic regions. However, at active genes, the levels of HP1a and H3K9me2/3 are lower in the extensions than in the cytogenomic regions.
Figure 7.
Figure 7.
Repetitive elements integrated within heterochromatic regions show similar epigenomic signatures. (A) Average enrichments (red) and depletions (blue) for particular chromatin marks (columns) in BG3 cells are shown for specific repetitive element types (rows) in euchromatic (left) and heterochromatic (right) regions (extended version with repeat names is shown in Supplemental Fig. 11 for BG3 cells, and Supplemental Fig. 12 for S2 cells). The color spectrum for the enrichment level (log2 scale) is the same as in Figure 5. The fraction of the heterochromatic repeats found in the BG3 extension regions is reported in the grayscale column on the right. The heterochromatic instances of all repeat types are marked by strong enrichment in HP1a, SU(VAR)3-9, and H3K9me2/3. In contrast, euchromatic repeat instances are associated with different types of chromatin patterns that vary in the levels of “active” and “silent” marks. Elements with similar patterns are marked by colored vertical bars on the left; red, highly enriched for “silent” marks, depleted for “active” marks; green, low enrichment or depletion for “silent” marks, highly enriched for “active” marks; orange, mixed enrichments for both “active” and “silent” marks. (B) Full-scale view of the top-most portion of the plot, showing repeat types for which euchromatic and heterochromatic instances show similar average chromatin patterns with predominant enrichments for “silent” marks. The RepBase repeat type names are shown on the left, with the number of instances found within each region to the right. In contrast, repeat types with mixed (C) and “active” (D) chromatin patterns in euchromatic regions (left) show predominantly “silent” mark enrichments when located in heterochromatin (right).
Figure 8.
Figure 8.
BG3 and S2 cells show novel domains of H3K9me2 enrichment within euchromatic regions. (A) Regions of H3K9me2 enrichment across different cell types. The euchromatic portion of the genome (excluding regions defined as heterochromatin by the border analysis; see Fig. 3A) was subdivided into sets of regions that exhibit a common pattern of H3K9me2 enrichment across different cell types. Each box shows the fraction (grayscale) of the regions belonging to the set (row) that are enriched for H3K9me2 in a particular cell type (column). The histogram on the left shows the fraction of the euchromatic genome in each row (1–7), with exact %s to the left. Regions in row 7 lack H3K9me2 across all examined cell types, whereas row 1 groups regions enriched for H3K9me2 in all examined cell types (except for Kc cells). Rows 2–6 identify other euchromatic regions that display H3K9me2 enrichment in only a subset of cell types (e.g., only BG3 cells (row 5) or S2 cells (row 3), or both (row 2). Panel 2 shows the fraction of sequence within each group associated with different parts of annotated genes (gene, entire gene; TSS-prox. [±500 bp of the TSS annotated in Flybase], 3'-prox. [±500 bp of the 3'end annotated in Flybase], and intron are a subset of the sequences included in the “gene” column). The third panel shows over-/under-representation of each cluster on different chromosome arms, which was calculated by comparing the fraction of sequence of a cluster on a specific chromosome with the fraction of sequence the chromosome contributed to the array. (B) Average enrichment of chromatin marks in the cell-type-specific H3K9me2 enrichment domains. Each row shows average enrichment levels (log2 scale) within regions corresponding to the main patterns seen in A. The specific regions were identified using HMM segmentation (see Methods). Panel 1 shows the average enrichment patterns in S2 cells, panel 2 shows the average enrichment patterns for the same genomic regions in BG3 cells, and panel 3 indicates the fraction of the particular H3K9me2 enrichment domain associated with gene features. While “common,” BG3 and BG3+S2 domains (rows 1–3) are enriched only for heterochromatic marks, the S2-specific and S2+Kc-specific domains (rows 4,5) include actively transcribed genes that in S2 cells are enriched for heterochromatic marks along with marks normally associated with transcription, similar to “mixed” state genes found in heterochromatin (Fig. 4). (C) Browser shot showing an example of a gene from a “common” (row 1) domain, located in the euchromatic arm of chromosome X, and enriched for H3K9me2 across all examined cell types except Kc cells. x-axis, chromosomal position in base pairs (centromere to the left). Genes are indicated in green with their orientations as indicated by the arrows. y-axis, H3K9me2 enrichment levels (log2 scale) for the indicated tissue. (D) A representative region of arm 3R containing an S2-specific domain (row 3), showing a combination of H3K9me2 (blue) and marks associated with active transcription—H3K36me3 (green), H3K4me3 (orange), and Pol II (red). Two sets of genes display a divergent promoter orientation typical of the S2-unique domain genes. X-axis, chromosomal position in base pairs; y-axis, enrichment levels (log2 scale).
Figure 9.
Figure 9.
Summary of chromatin patterns observed in Drosophila heterochromatin. The predominant enrichment patterns observed for selected histone modifications and proteins are summarized for active and silent genes and intergenic regions, in euchromatin, pericentric heterochromatin (including the S2-specific extensions), and the 4th chromosome. Red, “silent” marks and proteins; green, “active” marks. Heights of color blocks within each row indicate enrichment levels relative to the features shown below, whose combinatorial patterns are reflected in the colors and intensities. For example, the lighter red used for intergenic regions and silent genes in chromosome 4 indicate lower enrichments for “silent” marks compared with pericentric heterochromatin. Gradients across active genes reflect differences in the relative levels of “active” and “silent” marks; red, predominantly “silent” marks; green, predominantly “active” marks; yellow, enrichments for both. Silent genes in euchromatin are shown in gray to indicate the absence of “silent” marks.

References

    1. Abel J, Eskeland R, Raffa GD, Kremmer E, Imhof A 2009. Drosophila HP1c is regulated by an auto-regulatory feedback loop through its binding partner Woc. PLoS ONE 4: e5089 doi: 10.1371/journal.pone.0005089 - PMC - PubMed
    1. Allshire RC, Karpen GH 2008. Epigenetic regulation of centromeric chromatin: Old dogs, new tricks? Nat Rev Genet 9: 923–937 - PMC - PubMed
    1. Ayyanathan K, Lechner MS, Bell P, Maul GG, Schultz DC, Yamada Y, Tanaka K, Torigoe K, Rauscher FJ 3rd 2003. Regulated recruitment of HP1 to a euchromatic gene induces mitotically heritable, epigenetic gene silencing: A mammalian cell culture model of gene variegation. Genes Dev 17: 1855–1869 - PMC - PubMed
    1. Belyaeva ES, Andreyeva EN, Belyakin SN, Volkova EI, Zhimulev IF 2008. Intercalary heterochromatin in polytene chromosomes of Drosophila melanogaster. Chromosoma 117: 411–418 - PubMed
    1. Belyakin SN, Christophides GK, Alekseyenko AA, Kriventseva EV, Belyaeva ES, Nanayev RA, Makunin IV, Kafatos FC, Zhimulev IF 2005. Genomic analysis of Drosophila chromosome underreplication reveals a link between replication control and transcriptional territories. Proc Natl Acad Sci 102: 8269–8274 - PMC - PubMed

Publication types