. 2011 Mar;105(3):1063-70.
doi: 10.1152/jn.00807.2010. Epub 2010 Dec 22.

Somatosensory context alters auditory responses in the cochlear nucleus

Affiliations

Somatosensory context alters auditory responses in the cochlear nucleus

Patrick O Kanold et al. J Neurophysiol. 2011 Mar.

Abstract

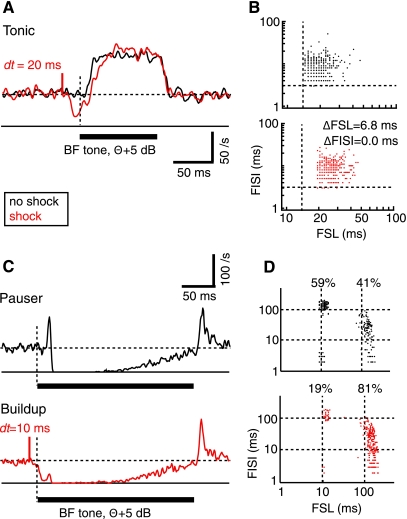
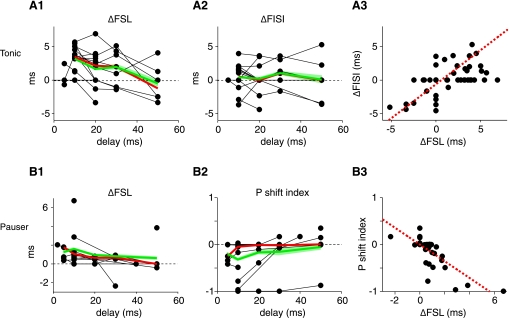
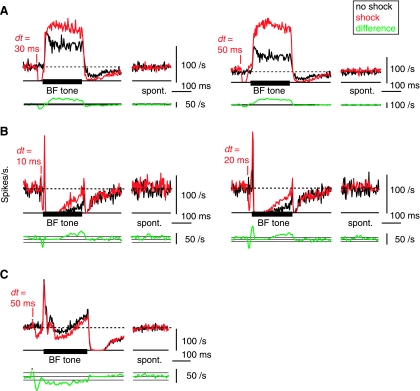
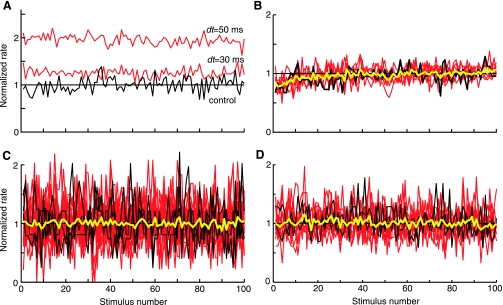
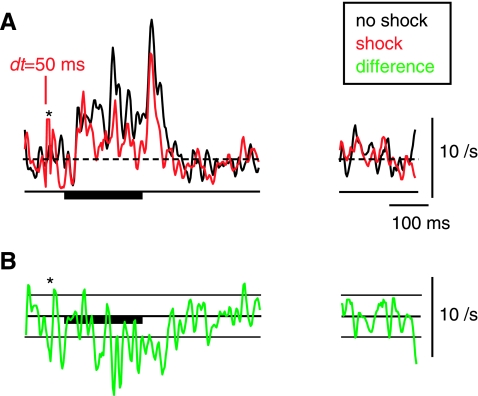
The cochlear nucleus, the first central auditory structure, performs initial stimulus processing and segregation of information into parallel ascending pathways. It also receives nonauditory inputs. Here we show in vivo that responses of dorsal cochlear nucleus (DCN) principal neurons to sounds can change significantly depending on the presence or absence of inputs from the somatosensory dorsal column nucleus occurring before the onset of auditory stimuli. The effects range from short-term suppression of spikes lasting a few milliseconds at the onset of the stimulus to long-term increases or decreases in spike rate that last throughout the duration of an acoustic stimulus (up to several hundred milliseconds). The long-term effect requires only a single electrical stimulus pulse to initiate and seems to be similar to persistent activity reported in other parts of the brain. Among the DCN inhibitory interneurons, only the cartwheel cells show a long-term rate decrease that could account for the rate increases (but not the decreases) of DCN principal cells. Thus even at the earliest stages of auditory processing, the represented information is dependent on nonauditory context, in this case somatosensory events.


Figures

Fig. 1.
Fig. 1.
Stimulation of dorsal column nuclei (DCoN) suppresses the first spike in response to a best frequency (BF) tone. A and C: responses to acoustic stimuli alone (black) are compared with responses to the acoustic stimuli preceded (with time interval dt) by a single bipolar electrical stimulus pulse in DCoN (red). A: tonic response. C: pauser response from a different neuron. Acoustic stimulus is marked by the heavy horizontal bar. Horizontal dashed line is the spontaneous discharge rate. Short red vertical solid line shows the time of the electrical stimulus, labeled with dt the time delay between the electrical stimulus pulse and the start of the stimulus tone. First spike is delayed in the tonic response in A, and pauser in C is converted to a buildup response by the DCoN stimulus. B and D: scatter plots of the first spike latency (FSL; abscissa) and first interspike interval (FISI; ordinate) measured from responses to individual stimuli. Dashed lines show the minimum first spike latency and first interspike interval in the absence of DCoN stimulation in B. Cell in B showed an increased first spike latency by 6.8 ms (P < 0.05), while first interspike interval did not change (NS). In D, the fraction of stimulus trials giving pauser (short first spike latency) and buildup (long first spike latency) responses is shown. Dashed lines show 10 and 100 ms to aid in lining up the data points. Peristimulus time histograms (PSTHs) are not smoothed.
Fig. 2.
Fig. 2.
Electrical stimulation of the DCoN changes the tone-evoked discharge pattern in tonic (A) and pauser type (B) responses for delays (dt) up to 50 ms. A: changes in first spike latency (A1) and first interspike interval (A2) in tonic cases. Each point is the difference in latency or interspike interval between cases with and without electrical stimulation, plotted vs. dt; only significant (P < 0.05) cases are plotted as non-zero ΔFSL or ΔFISI. Heavy red and green lines show medians and means computed at dt values with 3 or more observations. Green shading indicates the ±1 SE. Note that not all neurons were tested with all latencies. A3: changes in first spike latency and first interspike interval are correlated (dashed red line) (ΔFISI = −0.6076 + 0.4881 * ΔFSL; r2 = 0.338). B: pauser responses. B1: first spike latency increases with electrical stimulation in pauser trials for which the onset spike is not suppressed. B2. Firing mode of pauser responses changes for short dt values. Plotted is the relative change in the number of pauser trials P as defined in the text. P of −1 indicates that all “pauser” trials have converted to “buildup” trials. A P shift index of 0 indicates no change. A3: changes in first spike latency and P are correlated (dashed red line; P index = 0.0009 − 0.1781 * ΔFSL; r2 = 0.611).
Fig. 3.
Fig. 3.
Long-term changes in the tone-evoked firing rate after DCoN stimulation. Examples from 3 neurons in which the effects of a DCoN stimulus pulse lasted for the duration of the 200 ms acoustic stimulus. A: DCoN stimulation at 2 dt values increased the tone-evoked firing rate of a tonic neuron by 41.9 and 108.1%, respectively (top traces); compare the black control PSTHs with the red with-shock PSTHs. Small or no differences occurred in the spontaneous rates (“spont”). To quantify the significance of rate changes, the rate differences (with-shock minus no-shock) are plotted below (bottom green traces, smoothed with 5-bin triangular filter) together with horizontal lines showing ±1 SD of the spontaneous rate from the PSTHs. In A, this SD is too small to see on this scale. Significant rate changes are present where the rate differences are outside the ±1 SD area. Note that large rate differences persist for the duration of the stimulus. B: same for a pauser neuron in which DCoN stimulation also increased the tone-evoked firing rate by 125 and 146.5%, respectively. Also note the increase in the onset peak at dt = 20 ms. Again, no change occurred in the spontaneous rate. C: pauser response in which the long-term effect was a decrease in discharge rate. For this case, the shock and no-shock trials were interleaved on alternating trials, as opposed to A and B where they were interleaved with other stimuli in 100-repetition sets. PSTHs (except rate differences) were not smoothed.
Fig. 4.
Fig. 4.
Long-term rate changes occur on the first trial of a stimulus set and do not build up over time. A: average discharge rate over the duration of the 100 acoustic stimuli of a stimulus block for the control (black, no shock) and with-shock (red) stimuli at 2 values of dt. Rates are normalized by the average rate during the control stimuli (horizontal line). Same data as Fig. 3A. B: same plot for a similar neuron in which all rates are normalized by the average rate during the last 50 presentations. Yellow line is the average of all the other plots. Rate transients at the start of these stimulus blocks are identical for shock and no-shock cases and presumably are rate adaptation. Despite the adaptation, no trend in rate differences is seen in these data. C and D: same plot for 25 cases in 3 neurons with the largest rate increases (C) and 13 cases in 2 neurons with the largest rate decreases (D). No trend in rate differences are seen across these neurons.
Fig. 5.
Fig. 5.
Long-term rate changes in a cartwheel-cell inhibitory interneuron. A: rates in response to a BF tone following somatosensory electrical stimulation, plotted as in Fig. 3. B: point-by-point rate difference between the shock (red) and no-shock (black) histograms, with horizontal lines at ±1 SD of the spontaneous activity in the (unsmoothed) PSTHs. Asterisks show where a large stimulus artifact was eliminated. Plotted PSTHs and the difference plot were smoothed with a 5-bin triangular filter.

References

    1. Bell CC, Han VZ, Sugawara Y, Grant K. Synaptic plasticity in the mormyrid electrosensory lobe. J Exp Biol 202: 1339–1347, 1999 - PubMed
    1. Berrebi AS, Mugnaini E. Distribution and targets of the cartwheel cell axon in the dorsal cochlear nucleus of the guinea pig. Anat Embryol 183: 427–454, 1991 - PubMed
    1. Davis KA, Miller RL, Young ED. Effects of somatosensory and parallel-fiber stimulation on neurons in dorsal cochlear nucleus. J Neurophysiol 76: 3012–3024, 1996 - PubMed
    1. Davis KA, Young ED. Granule cell activation of complex-spiking neurons in dorsal cochlear nucleus. J Neurosci 17: 6798–6806, 1997 - PMC - PubMed
    1. Dehmel S, Cui YL, Shore SE. Cross-modal interactions of auditory and somatic inputs in the brainstem and midbrain and their imbalance in tinnitus and deafness. Am J Audiol 17: S193–S209, 2008 - PMC - PubMed

Publication types

MeSH terms

LinkOut - more resources