Comparative Study
. 2011 Feb 1;186(3):1685-93.
doi: 10.4049/jimmunol.1001359. Epub 2010 Dec 22.

A novel role for IFN-stimulated gene factor 3II in IFN-γ signaling and induction of antiviral activity in human cells

Affiliations
Comparative Study

A novel role for IFN-stimulated gene factor 3II in IFN-γ signaling and induction of antiviral activity in human cells

Angel N Morrow et al. J Immunol. .

Abstract

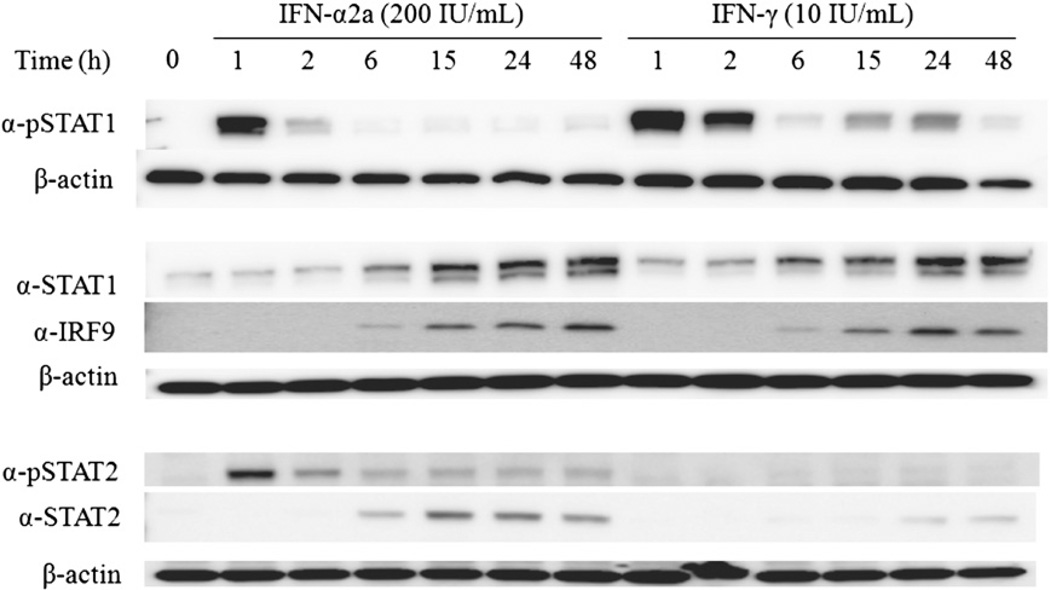
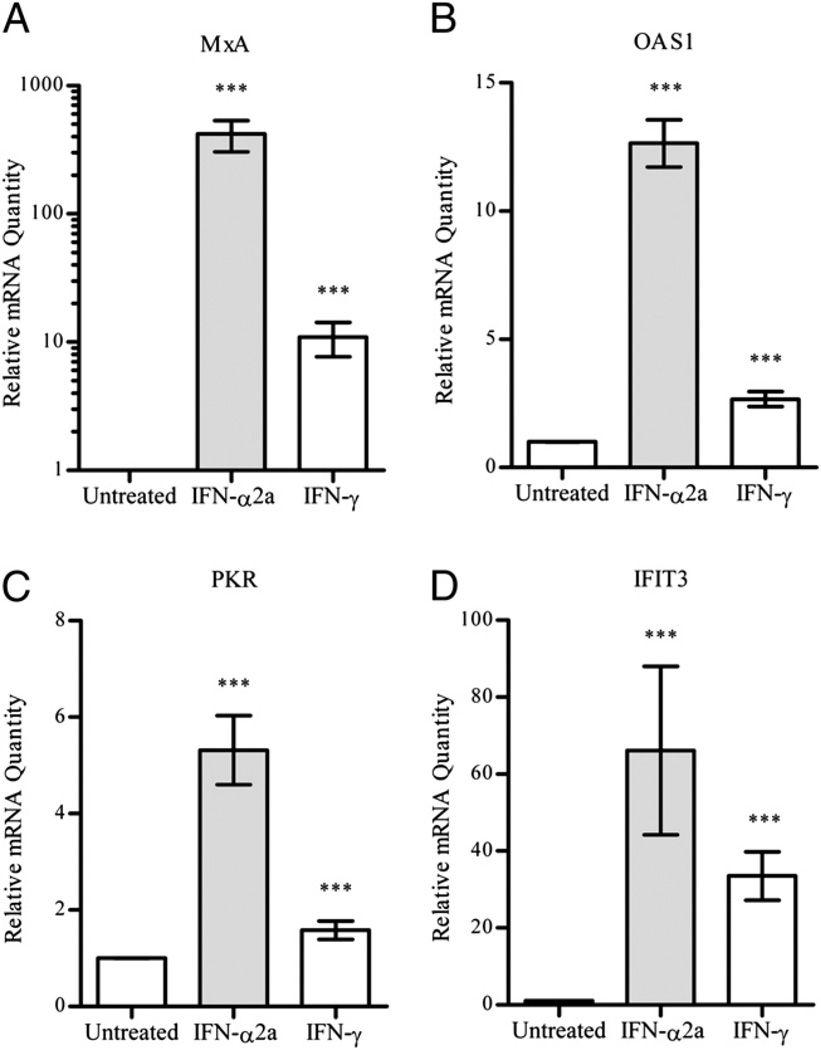
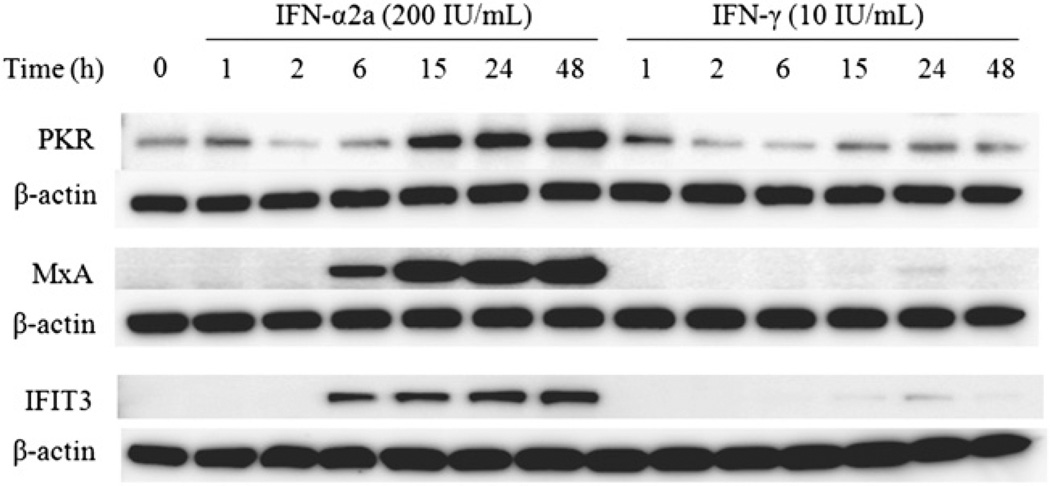
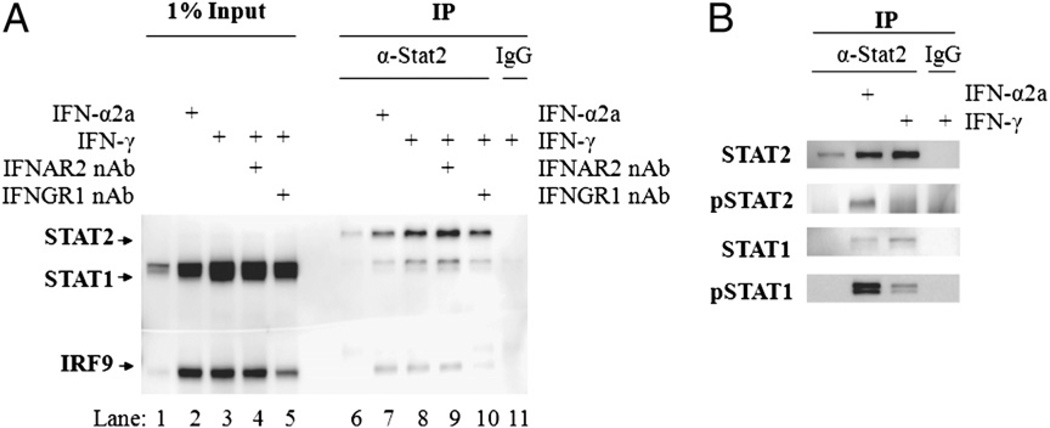
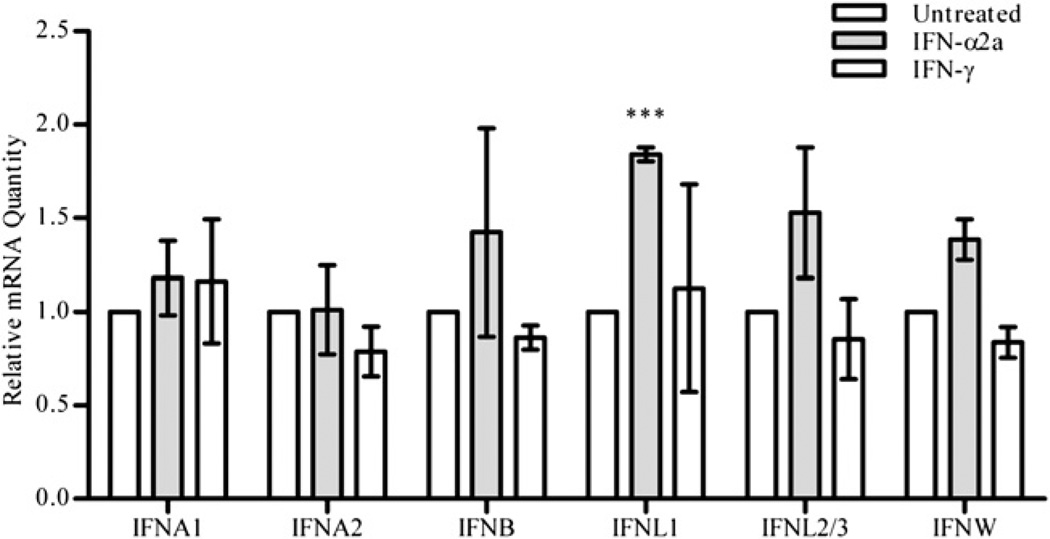
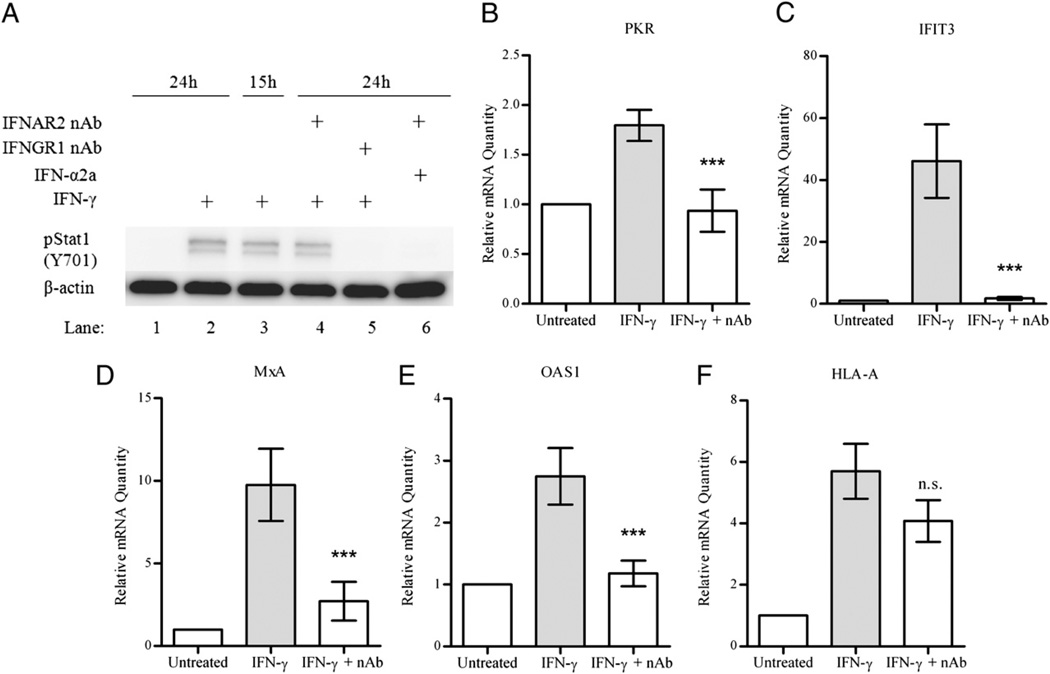
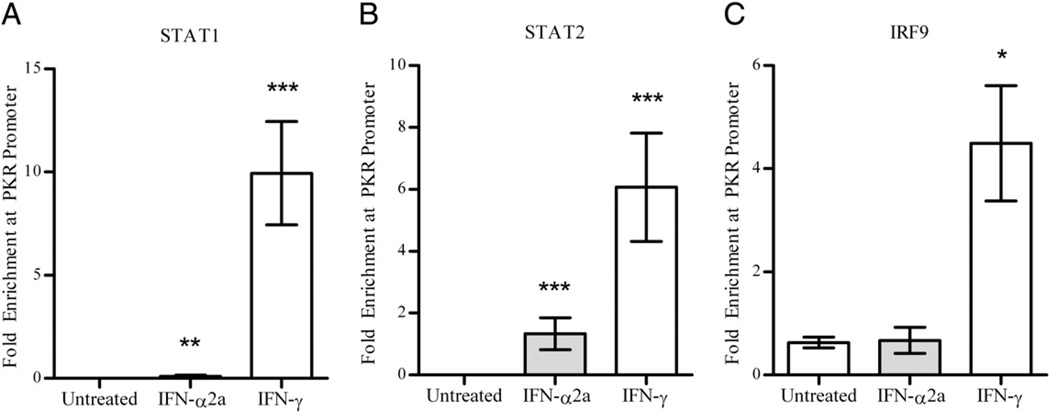
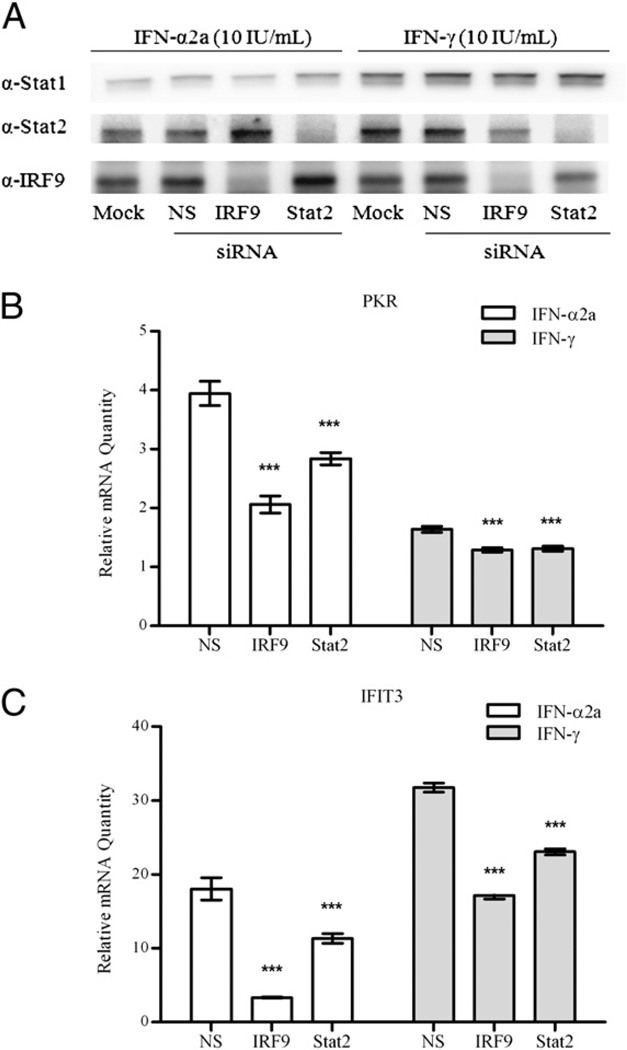
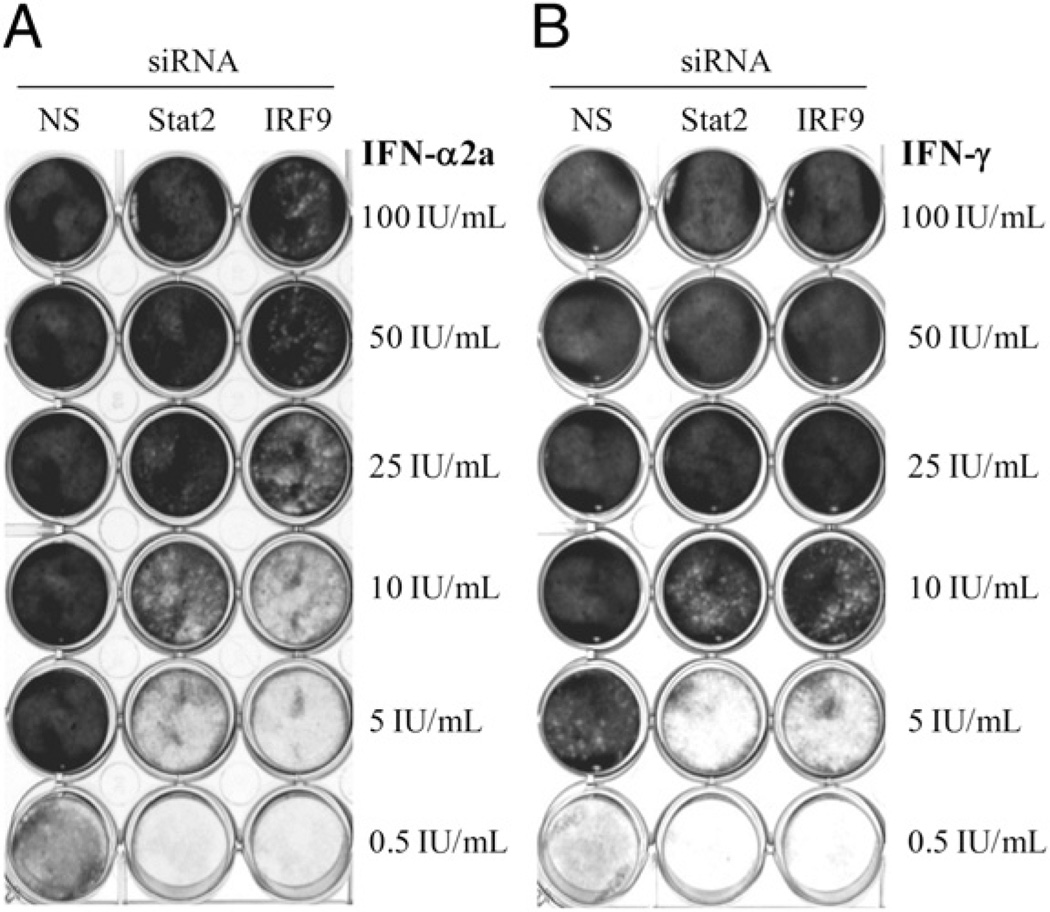
Type I (e.g., IFN-α, IFN-β) and type II IFNs (IFN-γ) have antiviral, antiproliferative, and immunomodulatory properties. Both types of IFN signal through the Jak/STAT pathway to elicit antiviral activity, yet IFN-γ is thought to do so only through STAT1 homodimers, whereas type I IFNs activate both STAT1- and STAT2-containing complexes such as IFN-stimulated gene factor 3. In this study, we show that IFN-stimulated gene factor 3 containing unphosphorylated STAT2 (ISGF3(II)) also plays a role in IFN-γ-mediated antiviral activity in humans. Using phosphorylated STAT1 as a marker for IFN signaling, Western blot analysis of IFN-α2a-treated human A549 cells revealed that phospho-STAT1 (Y701) levels peaked at 1 h, decreased by 6 h, and remained at low levels for up to 48 h. Cells treated with IFN-γ showed a biphasic phospho-STAT1 response with an early peak at 1-2 h and a second peak at 15-24 h. Gene expression microarray following IFN-γ treatment for 24 h indicated an induction of antiviral genes that are induced by IFN-stimulated gene factor 3 and associated with a type I IFN response. Induction of these genes by autocrine type I and type III IFN signaling was ruled out using neutralizing Abs to these IFNs in biological assays and by quantitative RT-PCR. Despite the absence of autocrine IFNs, IFN-γ treatment induced formation of ISGF3(II). This novel transcription factor complex binds to IFN-stimulated response element promoter sequences, as shown by chromatin immunoprecipitation analysis of the protein kinase R promoter. STAT2 and IFN regulatory factor 9 knockdown in A549 cells reversed IFN-γ-mediated IFN-stimulated response element induction and antiviral activity, implicating ISGF3(II) formation as a significant component of the cellular response and biological activity of IFN-γ.


Conflict of interest statement

Disclosures

The authors have no financial conflicts of interest.

Figures

FIGURE 1
FIGURE 1
STAT1 signaling response in A549 cells treated with IFN-α2a and IFN-γ. Western blot of A549 cells treated with IFN-α2a and IFN-γ showing kinetics of STAT1 (via phosphorylation at Y701) and STAT2 (via phosphorylation at Y689) activation as well as total STAT1, STAT2, and IRF9 expression. Cells were treated with 200 IU/ml IFN-α2a or 10 IU/ml IFN-γ, and cell lysates were prepared at the indicated times. Equal amounts of total protein were subjected to SDS-PAGE and analyzed by Western blot using the indicated Abs. β-actin is shown as a control.
FIGURE 2
FIGURE 2
Gene expression of select antiviral ISGs after IFN-α2a and IFN-γ treatment. Cells were treated with IFN for 24 h, after which total RNA was collected and assayed for relative mRNA transcript amounts of the ISGs MxA (A), OAS1 (B), PKR (C), and IFIT3 (D). The results are shown as the mean and SD of triplicate PCR reactions from three separate experiments. ***p < 0.001 by an unpaired, two-tailed t test for the indicated group compared with the untreated group.
FIGURE 3
FIGURE 3
Expression of antiviral ISGs in A549 cells treated with IFN-α and IFN-γ. Cell lysates (from Fig. 1) were evaluated for expression of the ISGs MxA, PKR, and IFIT3. Cells were treated with 200 IU/ml IFN-α2a or 10 IU/ml IFN-γ, and cell lysates were prepared at the indicated times. Equal amounts of total protein were subjected to SDS-PAGE and analyzed by Western blot using the indicated Abs. β-actin is shown as a control.
FIGURE 4
FIGURE 4
Neutralization of STAT1 activation in IFN-γ–treated cells and accumulation of ISGF3 lacking STAT2 phosphorylation. A, STAT2 Abs were used to coimmunoprecipitate the ISGF3 complex in A549 cells. Cells were left untreated (lane 6) or treated with 10 IU/ml IFN-α (lane 7) or IFN-γ (lanes 811) and harvested at 24 h. The IFNAR1 Ab was added immediately prior to IFN addition (lanes 4, 9), and the IFNGR1 Ab was added after IFN-γ treatment for 15 h (lanes 5, 10). A Western blot for the ISGF3 components (STAT1, STAT2, and IRF9) was performed on the immunoprecipitated samples. One percent of the total amount of input protein for each immunoprecipitation treatment (untreated, lane 1; IFN-α2a, lane 2; IFN-γ, lanes 3–5) was added for comparison purposes. B, Western blot for pSTAT2 (Y689), pSTAT1 (Y701), and total STAT2 and STAT1 on immunoprecipitated samples, as described in A.
FIGURE 5
FIGURE 5
Gene expression of IFN genes after IFN treatment. Cells were left untreated or treated with 10 IU/ml IFN-α2a or IFN-γ for 24 h, after which total RNA was collected and assayed for relative mRNA transcript amounts of IFN-α1, IFN-α2, IFN-β, IFN-λ1, IFN-λ2 or IFN-λ3, or IFN-ω. The results are shown as the mean and SD of triplicate PCR reactions from three separate experiments. ***p < 0.001 by two-way ANOVA with a Bonferroni post-test comparing the indicated gene in the treatment group compared with the untreated group.
FIGURE 6
FIGURE 6
Gene expression of select ISGs in IFN-γ–treated cells after neutralization with IFNGR1 Ab. A, IFN-treated cells were examined by Western blot for phosphorylation of STAT1 (at Y701) as an indicator of autocrine or paracrine IFN action. Cells were left untreated (lane 1) or treated with 10 IU/ml IFN-γ (lanes 2–5) or 10 IU/ml IFN-α2a (lane 6), and cell lysates were prepared at the indicated times. The IFNAR2 Ab was added prior to IFN treatment (lanes 4, 6), and the IFNGR1 Ab was added after 15-h IFN-γ treatment. nAb, neutralizing Ab. B–F, Cells were left untreated or treated with IFN-γ and harvested at 24 h, after which total RNA was collected and assayed for relative mRNA transcript amounts. The IFNGR1 Ab was added after 15 h of IFN-γ treatment and was present until harvest at 24 h. The relative mRNA levels of PKR (B), IFIT3 (C), MxA (D), OAS1 (E), and HLA-A (F) are shown as the mean and SD of triplicate PCR reactions from two separate experiments normalized to GAPDH. ***p < 0.001 and n.s., not significant by an unpaired, two-tailed t test comparing the IFN-γ and IFN-γ plus neutralizing Ab treatment groups.
FIGURE 7
FIGURE 7
Occupancy of the PKR promoter by (A) STAT1, (B) STAT2, and (C) IRF9 after IFN-γ and IFN-α2a treatment. Cross-linked, sheared chromatin ~1 kb in length from cells left untreated or treated with 10 IU/ml IFN-γ or 10 IU/ml IFN-α2a was immunoprecipitated with 1 µg nonimmune serum, 1 µg Ab against STAT1 and IRF9, or 2 µg Ab against STAT2. Quantitative PCR analysis was performed using a ChIP-specific primer for the PKR promoter. The results are shown as fold upregulation of occupancy at each site compared with background signal, and are the mean and SEM from triplicate PCR assays of a single biological experiment. The results are representative of three biological assays. ***p < 0.001; **p < 0.01; *p < 0.05 by two-tailed t test comparing the indicated group with the untreated control group.
FIGURE 8
FIGURE 8
Gene and protein expression of ISGs in STAT2- and IRF9-deficient cells after treatment with IFN-α2a or IFN-γ. A, STAT2 and IRF9 protein expression was knocked down by siRNA. Cells were either mock treated (lipofectamine only), treated with a nonspecific (NS) siRNA or siRNA for IRF9 or STAT2, and incubated with 10 IU/ml IFN-α or IFN-γ for 24 h. Cell lysates containing equivalent amounts of protein were added to each well and subjected to SDS-PAGE, after which Western blots were performed with STAT1, STAT2, or IRF9 Abs. BC, Gene expression for (B) PKR and (C) IFIT3 was determined by qRT-PCR in cells transfected with siRNA targeting IRF9 and STAT2 and treated with 10 IU/ml IFN-α2a or IFN-γ. Data are presented as the mean and SD of three replicate assay wells from a single experiment. ***p < 0.001 by a separate one-way ANOVA for each IFN treatment, followed by a Bonferroni posttest for comparison between IRF9 siRNA or STAT2 siRNA treatment and the nonspecific (NS) siRNA treatment.
FIGURE 9
FIGURE 9
The absence of IRF9 or STAT2 abrogates the antiviral activity of IFN-γ in A549 cells. Specific siRNAs targeting IRF9, STAT2, or nonspecific (NS) control siRNAs were transfected at a concentration of 20 nM for 24 h before addition of the indicated amounts of IFN-α2a (A) or IFN-γ (B). Following 24 h of the indicated treatment, media was removed and EMCV was added at a multiplicity of infection of 0.01. Cells were stained with crystal violet at 48 h postinfection. The results are representative of greater than three separate experiments.

References

    1. Pestka S, Langer JA, Zoon KC, Samuel CE. Interferons and their actions. Annu. Rev. Biochem. 1987;56:727–777. - PubMed
    1. Takaoka A, Yanai H. Interferon signalling network in innate defence. Cell. Microbiol. 2006;8:907–922. - PubMed
    1. Maher SG, Romero-Weaver AL, Scarzello AJ, Gamero AM. Interferon: cellular executioner or white knight? Curr. Med. Chem. 2007;14:1279–1289. - PubMed
    1. Bach EA, Aguet M, Schreiber RD. The IFN gamma receptor: a paradigm for cytokine receptor signaling. Annu. Rev. Immunol. 1997;15:563–591. - PubMed
    1. Stark GR, Kerr IM, Williams BR, Silverman RH, Schreiber RD. How cells respond to interferons. Annu. Rev. Biochem. 1998;67:227–264. - PubMed

Publication types

MeSH terms

Associated data