

Identifying cochlear implant channels with poor electrode-neuron interfaces: electrically evoked auditory brain stem responses measured with the partial tripolar configuration
- PMID: 21178633
- PMCID: PMC3082606
- DOI: 10.1097/AUD.0b013e3181ff33ab
Identifying cochlear implant channels with poor electrode-neuron interfaces: electrically evoked auditory brain stem responses measured with the partial tripolar configuration
Abstract
Objectives: The goal of this study was to compare cochlear implant behavioral measures and electrically evoked auditory brain stem responses (EABRs) obtained with a spatially focused electrode configuration. It has been shown previously that channels with high thresholds, when measured with the tripolar configuration, exhibit relatively broad psychophysical tuning curves. The elevated threshold and degraded spatial/spectral selectivity of such channels are consistent with a poor electrode-neuron interface, defined as suboptimal electrode placement or reduced nerve survival. However, the psychophysical methods required to obtain these data are time intensive and may not be practical during a clinical mapping session, especially for young children. Here, we have extended the previous investigation to determine whether a physiological approach could provide a similar assessment of channel functionality. We hypothesized that, in accordance with the perceptual measures, higher EABR thresholds would correlate with steeper EABR amplitude growth functions, reflecting a degraded electrode-neuron interface.
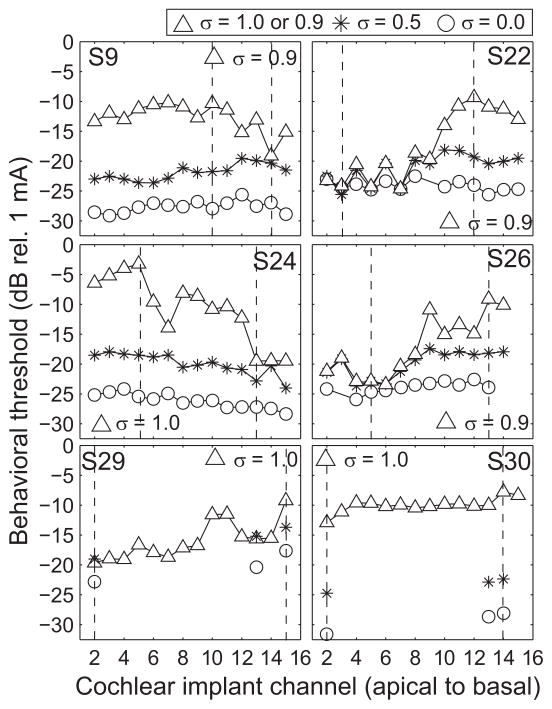
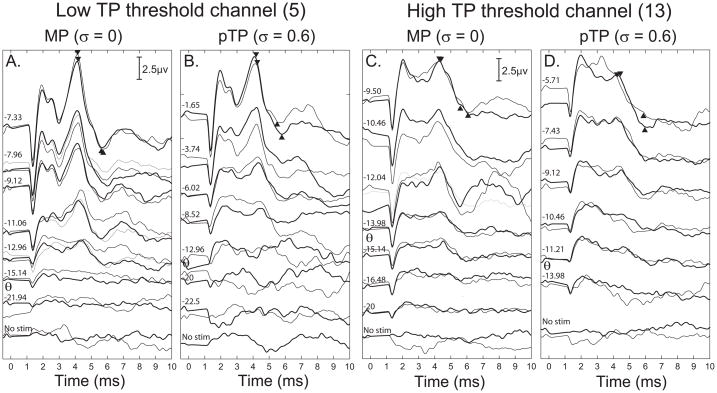
Design: Data were collected from six cochlear implant listeners implanted with the HiRes 90k cochlear implant (Advanced Bionics). Single-channel thresholds and most comfortable listening levels were obtained for stimuli that varied in presumed electrical field size by using the partial tripolar configuration, for which a fraction of current (σ) from a center active electrode returns through two neighboring electrodes and the remainder through a distant indifferent electrode. EABRs were obtained in each subject for the two channels having the highest and lowest tripolar (σ = 1 or 0.9) behavioral threshold. Evoked potentials were measured with both the monopolar (σ = 0) and a more focused partial tripolar (σ ≥ 0.50) configuration.
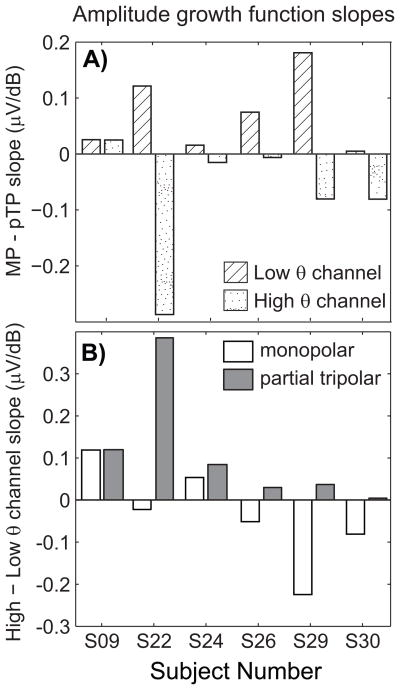
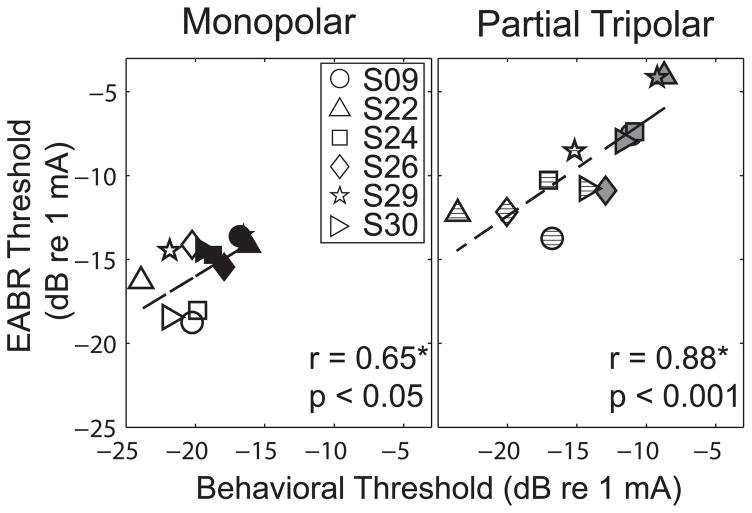
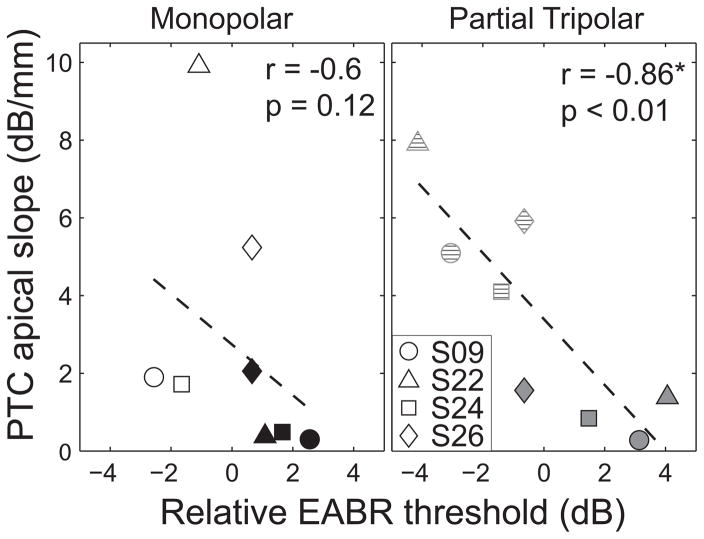
Results: Consistent with previous studies, EABR thresholds were highly and positively correlated with behavioral thresholds obtained with both the monopolar and partial tripolar configurations. The Wave V amplitude growth functions with increasing stimulus level showed the predicted effect of shallower growth for the partial tripolar than for the monopolar configuration, but this was observed only for the low-threshold channels. In contrast, high-threshold channels showed the opposite effect; steeper growth functions were seen for the partial tripolar configuration.
Conclusions: These results suggest that behavioral thresholds or EABRs measured with a restricted stimulus can be used to identify potentially impaired cochlear implant channels. Channels having high thresholds and steep growth functions would likely not activate the appropriate spatially restricted region of the cochlea, leading to suboptimal perception. As a clinical tool, quick identification of impaired channels could lead to patient-specific mapping strategies and result in improved speech and music perception.
Figures

Similar articles
-
Identifying cochlear implant channels with poor electrode-neuron interface: partial tripolar, single-channel thresholds and psychophysical tuning curves.Ear Hear. 2010 Apr;31(2):247-58. doi: 10.1097/AUD.0b013e3181c7daf4. Ear Hear. 2010. PMID: 20090533 Free PMC article.
-
Comparisons between detection threshold and loudness perception for individual cochlear implant channels.Ear Hear. 2014 Nov-Dec;35(6):641-51. doi: 10.1097/AUD.0000000000000058. Ear Hear. 2014. PMID: 25036146 Free PMC article.
-
Identifying Cochlear Implant Channels With Relatively Poor Electrode-Neuron Interfaces Using the Electrically Evoked Compound Action Potential.Ear Hear. 2020 Jul/Aug;41(4):961-973. doi: 10.1097/AUD.0000000000000844. Ear Hear. 2020. PMID: 31972772 Free PMC article.
-
Probing the electrode-neuron interface with focused cochlear implant stimulation.Trends Amplif. 2010 Jun;14(2):84-95. doi: 10.1177/1084713810375249. Trends Amplif. 2010. PMID: 20724356 Free PMC article. Review.
-
Forward masking as a method of measuring place specificity of neural excitation in cochlear implants: a review of methods and interpretation.J Acoust Soc Am. 2012 Mar;131(3):2209-24. doi: 10.1121/1.3683248. J Acoust Soc Am. 2012. PMID: 22423717 Review.
Cited by
-
Electric Auditory Brainstem Response Audiometry in Cochlear Implants: New Recording Paradigm.Audiol Res. 2024 Jun 26;14(4):581-592. doi: 10.3390/audiolres14040049. Audiol Res. 2024. PMID: 39051193 Free PMC article.
-
Electrical Field Interactions during Adjacent Electrode Stimulations: eABR Evaluation in Cochlear Implant Users.J Clin Med. 2023 Jan 11;12(2):605. doi: 10.3390/jcm12020605. J Clin Med. 2023. PMID: 36675534 Free PMC article.
-
Relationships Among Peripheral and Central Electrophysiological Measures of Spatial and Spectral Selectivity and Speech Perception in Cochlear Implant Users.Ear Hear. 2015 Jul-Aug;36(4):441-53. doi: 10.1097/AUD.0000000000000144. Ear Hear. 2015. PMID: 25658746 Free PMC article.
-
Single-Channel Focused Thresholds Relate to Vowel Identification in Pediatric and Adult Cochlear Implant Listeners.Trends Hear. 2022 Jan-Dec;26:23312165221095364. doi: 10.1177/23312165221095364. Trends Hear. 2022. PMID: 35505617 Free PMC article.
-
Polarity Sensitivity in Pediatric and Adult Cochlear Implant Listeners.Trends Hear. 2019 Jan-Dec;23:2331216519862987. doi: 10.1177/2331216519862987. Trends Hear. 2019. PMID: 31373266 Free PMC article.
References
-
- Abbas PJ, Brown CJ. Electrically evoked auditory brainstem response: growth of response with current level. Hear Res. 1991;51:123–37. - PubMed
-
- Bierer JA. Threshold and channel interaction in cochlear implant users: evaluation of the tripolar electrode configuration. J Acoust Soc Am. 2007;121:1642–53. - PubMed
-
- Black RC, Clark GM. Differential electrical excitation of the auditory nerve. J Acoust Soc Am. 1980;67:868–74. - PubMed
Publication types
MeSH terms
Grants and funding
LinkOut - more resources
Full Text Sources
Other Literature Sources
Medical
Research Materials
