

In vivo binding of antipsychotics to D3 and D2 receptors: a PET study in baboons with [11C]-(+)-PHNO
- PMID: 21178982
- PMCID: PMC3055723
- DOI: 10.1038/npp.2010.228
In vivo binding of antipsychotics to D3 and D2 receptors: a PET study in baboons with [11C]-(+)-PHNO
Abstract
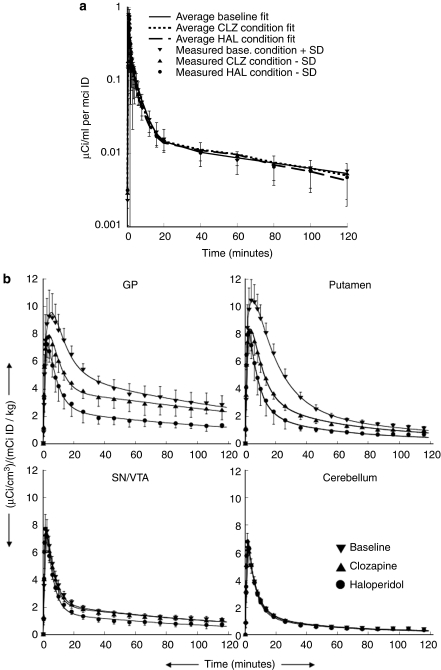
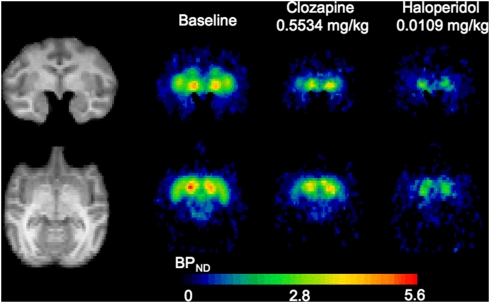
Measuring the in vivo occupancy of antipsychotic drugs at dopamine D(2) and D(3) receptors separately has been difficult because of the lack of selective radiotracers. The recently developed [(11)C]-(+)-PHNO is D(3)-preferring, allowing estimates of the relative D(2) and D(3) binding of antipsychotic drugs. We used positron emission tomography (PET) imaging in baboons with [(11)C]-(+)-PHNO to examine the binding of clozapine and haloperidol to D(2) and D(3) receptors. Four animals were scanned with dynamically acquired PET and arterial plasma input functions. Test and retest scans were acquired in single scanning sessions for three subjects to assess the reproducibility of [(11)C]-(+)-PHNO scans. Four additional scans were acquired in each of three subjects following single doses of antipsychotic drugs (clozapine 0.5534 mg/kg, haloperidol 0.0109 mg/kg, two administrations per drug per subject) and compared with baseline scans. The percent change in binding (ΔBP(ND)) following challenges with antipsychotic drugs was measured. A regression model, based on published values of regional D(2) and D(3) fractions of [(11)C]-(+)-PHNO BP(ND) in six brain regions, was used to infer occupancy at D(2) and D(3) receptors. BP(ND) following antipsychotic challenge decreased in all regions. Estimated D(2) : D(3) selectivity was 2.38 for haloperidol and 5.25 for clozapine, similar to published in vitro values for haloperidol (3.03), but slightly higher for clozapine (2.82). These data suggest that acute doses of clozapine and haloperidol bind to D(3) receptors in vivo, and that the lack of D(3) occupancy by antipsychotics observed in some recent imaging studies may be because of other phenomena.
Figures
References
-
- Abi-Dargham A, Martinez D, Mawlawi O, Simpson N, Hwang DR, Slifstein M, et al. Measurement of striatal and extrastriatal dopamine D-1 receptor binding potential with [C-11]NNC 112 in humans: validation and reproducibility. J Cerebr Blood F Met. 2000;20:225–243. - PubMed
-
- Beaver JD, Gallezot JD, Nabulsi N, Weinzimmer D, Singhal T, Slifstein M, et al. PHNO in vivo affinity for D2 and D3 receptors: a PET study in rhesus monkeys. J Cerebr Blood F Met. 2009;29:S59–S62.
-
- Cheng YF, Lundberg T, Bondesson U, Lindstrom L, Gabrielsson J. Clinical pharmacokinetics of clozapine in chronic schizophrenic patients. Eur J Clin Pharmacol. 1988;34:445–449. - PubMed
-
- Creese I, Burt DR, Snyder SH. Dopamine receptor binding predicts clinical and pharmacological potencies of antischizophrenic drugs. Science. 1976;192:481–483. - PubMed
-
- Ekelund J, Slifstein M, Narendran R, Guillin O, Belani H, Guo NN, et al. In vivo DA D-1 receptor selectivity of NNC 112 and SCH 23390. Mol Imaging and Biol. 2007;9:117–125. - PubMed
Publication types
MeSH terms
Substances
LinkOut - more resources
Full Text Sources
Other Literature Sources
