. 2010 Dec 21:6:445.
doi: 10.1038/msb.2010.95.

Single-gene tuning of Caulobacter cell cycle period and noise, swarming motility, and surface adhesion

Affiliations

Single-gene tuning of Caulobacter cell cycle period and noise, swarming motility, and surface adhesion

Yihan Lin et al. Mol Syst Biol. .

Abstract

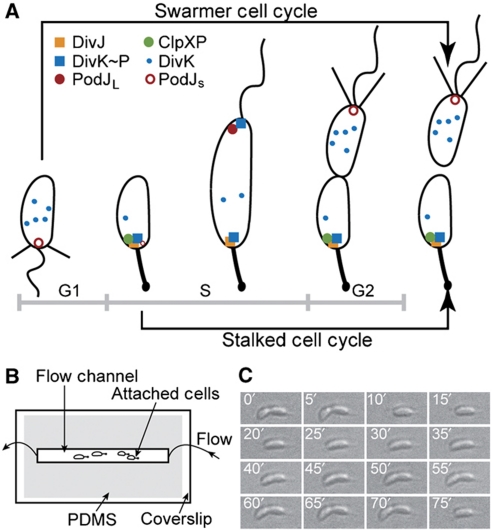
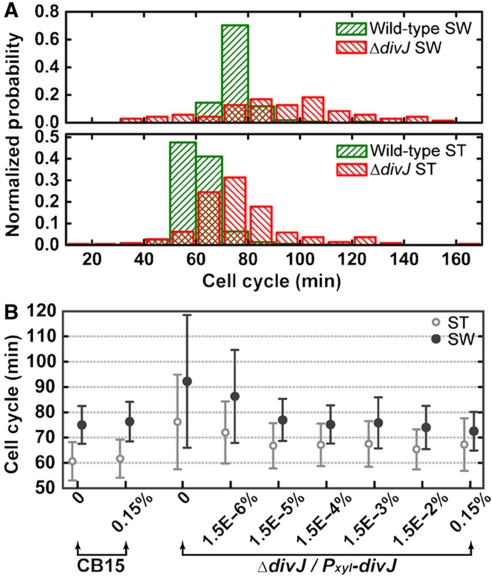
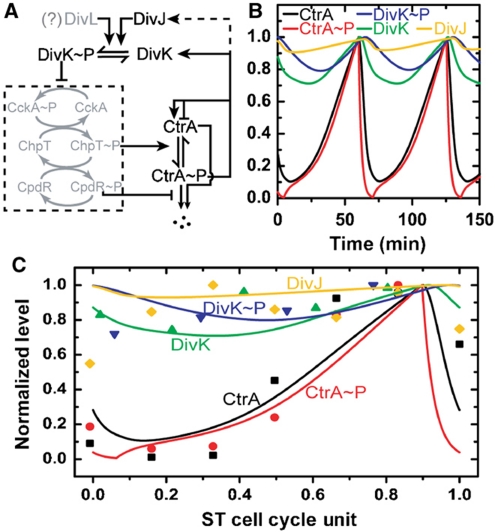
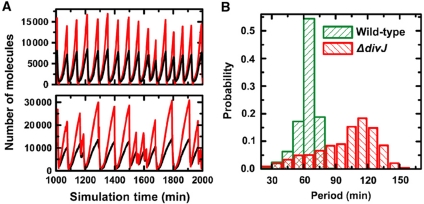
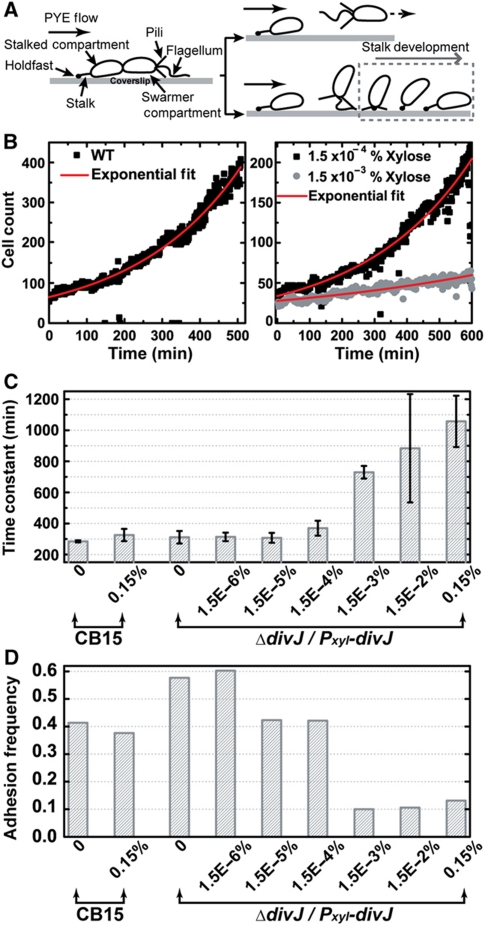
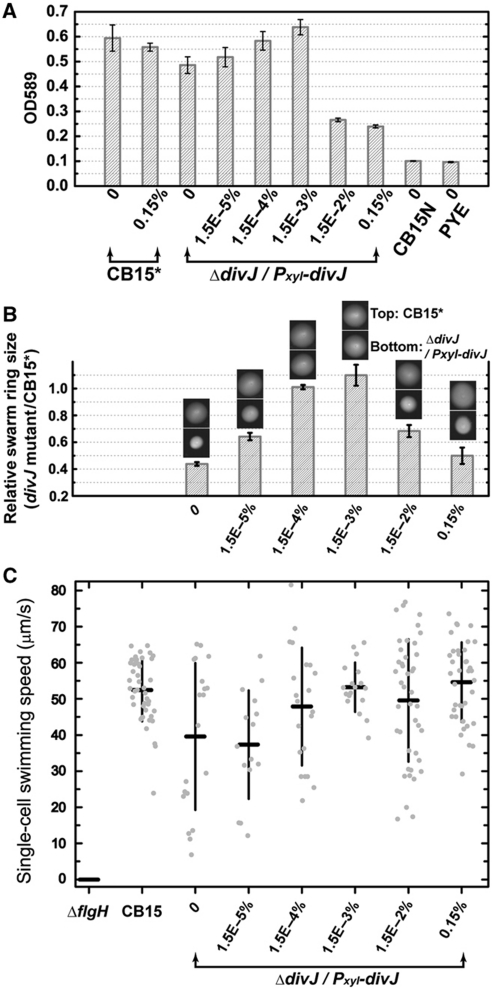
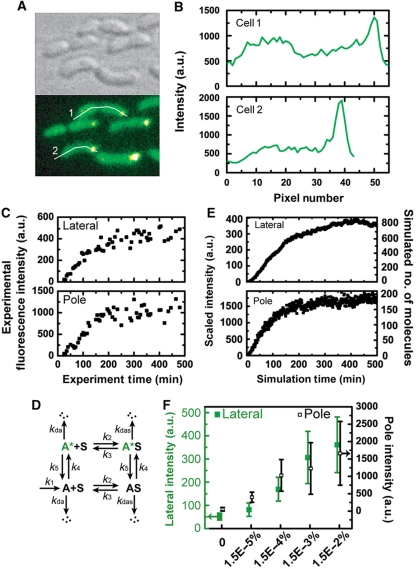
Sensor histidine kinases underlie the regulation of a range of physiological processes in bacterial cells, from chemotaxis to cell division. In the gram-negative bacterium Caulobacter crescentus, the membrane-bound histidine kinase, DivJ, is a polar-localized regulator of cell cycle progression and development. We show that DivJ localizes to the cell pole through a dynamic diffusion and capture mechanism rather than by active localization. Analysis of single C. crescentus cells in microfluidic culture demonstrates that controlled expression of divJ permits facile tuning of both the mean and noise of the cell division period. Simulations of the cell cycle that use a simplified protein interaction network capture previously measured oscillatory protein profiles, and recapitulate the experimental observation that deletion of divJ increases the cell cycle period and noise. We further demonstrate that surface adhesion and swarming motility of C. crescentus in semi-solid media can also be tuned by divJ expression. We propose a model in which pleiotropic control of polar cell development by the DivJ-DivK-PleC signaling pathway underlies divJ-dependent tuning of cell swarming and adhesion behaviors.


Conflict of interest statement

The authors declare that they have no conflict of interest.

Figures

Figure 1
Figure 1
Caulobacter crescentus cell cycle and experimental schematic. (A) C. crescentus swarmer (SW) and stalked (ST) division cycles and dynamic protein localization. The life cycle of C. crescentus begins at the SW stage (G1 phase), transitions into the stalked stage (S phase), and then progresses through early predivisional and late predivisional stages. Two morphologically and functionally distinct progeny are generated. Subcellular localization of DivK, DivJ, ClpXP, and PodJ are illustrated. (B) Top view of our microfluidic device (not drawn to scale). The microfluidic flow chamber is defined by a microscope coverslip and a PDMS channel, allowing for time-lapse single-cell analysis by bright-field and fluorescence microscopy. (C) A dividing wild-type C. crescentus cell (CB15) on the coverslip surface. Successive DIC images (time is indicated in white) of a dividing C. crescentus cell are shown. Images are arranged from left to right and from top to bottom. The direction of flow is from right to left.
Figure 2
Figure 2
Single-cell analysis of the dependence of cell cycle timing on xylose-inducible divJ expression. (A) Distributions of SW and ST cell cycle times. The SW and ST cell cycle time (in minutes) distributions (normalized frequency) for wild-type and ΔdivJ mutant cells (ΔdivJ/Pxyl-divJ) at 0% xylose (i.e., no divJ induction) are shown (n=118, 519, 71, and 224 for wild-type SW and ST, mutant SW and ST, respectively). (B) The mean and s.d. value of the SW and ST cell cycle time distributions measured for increasing divJ induction levels in the ΔdivJ/Pxyl-divJ mutant strain. Cell cycle time statistics (mean and s.d.) are plotted for wild-type at 0 and 0.15% (w/v) xylose and for the divJ mutant from 0 to 0.15% xylose (n=41 to 689).
Figure 3
Figure 3
Deterministic simulation of C. crescentus ST cell cycle oscillatory period. (A) Simplified regulatory network for ST cell cycle. Regulation of CtrA oscillation is modeled by a five-component protein interaction network (see Materials and methods section for details). The model only includes the components shown in black (i.e. the gray-shaded part of the network is simplified). The dash box indicates a phosphorelay system that is approximated as a binary switch controlled by the DivK∼P level. (B) Protein concentrations (normalized) trajectories over about two cell cycle periods. The model is described by coupled differential equations and is solved to obtain trajectories as shown. (C) Comparison of simulation with experimental data. Experimental protein levels (solid symbols) are extracted from published immunoblot data for the five components included in the model (CtrA (Holtzendorff et al, 2004), CtrA∼P (Jacobs et al, 2003), DivK (Jacobs et al, 2001), DivK∼P (Jacobs et al, 2001), and DivJ (Wheeler and Shapiro, 1999)). The cell cycle periods are normalized to 1. ST cell data are then taken from 15 to 100% of the SW cell data (∼15% of time for SW-ST transition (Keiler and Shapiro, 2003)) and the time is rescaled by 0.85 to yield ST cell cycle unit (0–1).
Figure 4
Figure 4
Stochastic simulation of C. crescentus cell cycle oscillations in the presence and absence of divJ. (A) Representative traces from stochastic model simulation. Sample CtrA (black) and CtrA∼P (red) trajectories are shown for wild-type (upper) and ΔdivJ (lower) cells. (B) CtrA oscillation period distributions for wild-type and ΔdivJ cells. Stochastic trajectories of CtrA∼P are used to calculate inter-peak distances (times) and normalized histograms of the inter-peak distances are plotted for wild-type (62.9±9.0 min, n=1419 versus 64.5 min from deterministic model) and ΔdivJ (100.0±27.4 min, n=889 versus 103.0 min from deterministic model) cells.
Figure 5
Figure 5
The dependence of C. crescentus surface adhesion and monolayer biofilm formation on divJ expression. (A) Initial surface attachment of SW cells in the microfluidic channel. In the cartoon, a late pre-divisional cell exposed to hydrodynamic flow is drawn (left) with labels indicating its cellular structures. When the SW progeny detaches, it may either be carried away by the fluid flow (upper right) or adhere to the surface near its mother cell (lower right). (B) Monolayer biofilm formation dynamics. The time trajectory of the number of cells on the surface is plotted (solid symbols) and the data is fitted with an exponential growth model (red solid curve). Sample trajectories for wild-type C. crescentus strain CB15 without xylose (left) and the ΔdivJ/Pxyl-divJ mutant cells exposed to two xylose concentrations (right) are presented. The fitted time constants are 284 min for wild-type (left), 332 min for 1.5 × 10⁻⁴% xylose (right, upper), and 779 min for 1.5 × 10⁻³% (right, lower). (C) The rate of biofilm monolayer formation for increasing levels of divJ induction in ΔdivJ/Pxyl-divJ. The horizontal axis indicates the bacterial strain and xylose concentration. The time constants are obtained by exponential fitting of trajectories as shown in (B). Error bars represent s.d. (n=4). (D) SW cell adhesion frequency for increasing levels of divJ induction. The adhesion frequency is calculated as the ratio: (number of new born SW cells that adhere to the surface)/(total number of new born SW cells).
Figure 6
Figure 6
Characterization of ensemble surface adhesion, swarming motility, and swimming motility for different divJ expression levels. (A) Quantification of attachment of the ΔdivJ/Pxyl-divJ mutant strain to polystyrene surfaces for different (xylose induced) divJ expression levels. CB15* is the CB15 strain carrying an empty TetR vector (FC 652). CB15N is the non-adhesive strain used as a negative control. Background is quantified by blank PYE. Error bars represent s.d. (n=4). (B) Quantification of the swarming motility of the ΔdivJ/Pxyl-divJ mutant for different divJ expression levels. The sizes (i.e. areas) of the swarm rings for the xylose-inducible divJ mutant strain were normalized to the mean sizes of the CB15* swarm rings on the same plate. Sample photographs of swarm rings are shown for each xylose condition (top: CB15*; bottom: divJ mutant). Error bars represent s.d. (n=5). (C) Quantification of the swimming motility of the ΔdivJ/Pxyl-divJ mutant for different divJ expression levels. A non-motile ΔflgH strain (FC1266) was used as negative control. The speeds for individual motile cells (gray dots, the spread on the horizontal axis is artificially added to allow the points to be visualized) and the mean±s.d. of the population were plotted for each culture (n=15–44), except for ΔflgH strain in which no motile cells were observed. The average speed for CB15 is consistent with the previously reported value (Li and Tang, 2006).
Figure 7
Figure 7
Single-cell fluorescence localization, kinetics of DivJ–EGFP and model simulation. (A) C. crescentus cells in microfluidic culture expressing DivJ–EGFP. Bright-field DIC image (upper left) and a false-color fluorescence image from the same area (lower left) for divJ∷Tn5 (ΔdivJ) cells expressing divJ-egfp from the xylX chromosomal locus for 0.015% xylose induction. (B) Spatial profile of EGFP fluorescence. The plots are the fluorescence intensity profiles along the white lines indicated in (A) for cell #1 (upper) and cell #2 (lower). The horizontal coordinate represents the distance from the leftmost of each line in pixels. (C) Sample single-cell temporal fluorescence intensity traces obtained for 0.015% xylose for the same mutant construct. (D) Kinetic model where the species corresponding to experimental observables are A* (lateral membrane-bound) and A*S (pole localized). (E) Time traces for A* and A*S from simulation. The numbers of molecules are simulated with k1=0.37 (Supplementary Table VII). The simulated molecule numbers are scaled as intensities for comparison with experimental trajectories (see Supplementary information for details). (F) Steady-state fluorescence intensities obtained for different inducer concentrations. Cells in the microfluidic channel were induced with different levels of xylose for 6 h and their intensities were characterized, except for the zero xylose condition in which the intensities were characterized before induction. Lateral membrane intensities (green solid squares) and stalked pole intensities (black open squares) are associated with the left and right y-axis, respectively. Error bars represent s.d. (n=23–29).

References

    1. Alley MRK, Maddock JR, Shapiro L (1992) Polar localization of a bacterial chemreceptor. Genes Dev 6: 825–836 - PubMed
    1. Bardy SL, Maddock JR (2007) Polar explorations: recent insights into the polarity of bacterial proteins. Curr Opin Microbiol 10: 617–623 - PubMed
    1. Battogtokh D, Aihara K, Tyson JJ (2006) Synchronization of eukaryotic cells by periodic forcing. Phys Rev Lett 96: 148102–148104 - PubMed
    1. Biondi EG, Reisinger SJ, Skerker JM, Arif M, Perchuk BS, Ryan KR, Laub MT (2006) Regulation of the bacterial cell cycle by an integrated genetic circuit. Nature 444: 899–904 - PubMed
    1. Bodenmiller D, Toh E, Brun YV (2004) Development of surface adhesion in Caulobacter crescentus. J Bacteriol 186: 1438–1447 - PMC - PubMed

MeSH terms