. 2010 Dec 21:6:448.
doi: 10.1038/msb.2010.104.

Defining the budding yeast chromatin-associated interactome

Affiliations

Defining the budding yeast chromatin-associated interactome

Jean-Philippe Lambert et al. Mol Syst Biol. .

Abstract

We previously reported a novel affinity purification (AP) method termed modified chromatin immunopurification (mChIP), which permits selective enrichment of DNA-bound proteins along with their associated protein network. In this study, we report a large-scale study of the protein network of 102 chromatin-related proteins from budding yeast that were analyzed by mChIP coupled to mass spectrometry. This effort resulted in the detection of 2966 high confidence protein associations with 724 distinct preys. mChIP resulted in significantly improved interaction coverage as compared with classical AP methodology for ∼75% of the baits tested. Furthermore, mChIP successfully identified novel binding partners for many lower abundance transcription factors that previously failed using conventional AP methodologies. mChIP was also used to perform targeted studies, particularly of Asf1 and its associated proteins, to allow for a understanding of the physical interplay between Asf1 and two other histone chaperones, Rtt106 and the HIR complex, to be gained.


Conflict of interest statement

The authors declare that they have no conflict of interest.

Figures

Figure 1
Figure 1
Overview of mChIP-MS procedure and results. (A) Experimental platform for the large-scale characterization of chromatin-associated proteins by mChIP-MS in Saccharomyces cerevisiae. See Materials and methods section for complete details of the mChIP-MS pipeline. (B) Summary of the mChIP-MS data set. (C) Two-dimensional hierarchical clustering of bait interaction profiles between the 102 different bait analyzed by mChIP-MS. The overlap between the preys identified in individual mChIP-MS experiments was defined by first computing the distance measure based on the cosine function using the preys peptide count. Subsequently, the heat map was generated using the cluster software and visualized with Java Treeview from the computed bait–bait distance matrix. In addition, some known protein complexes were manually highlighted on the heat map. See Supplementary Figure S2 for a high-resolution image of the cluster.
Figure 2
Figure 2
Characterization of the mChIP-MS interactome. (A) Heat map generated from the two-dimensional hierarchical clustering (Pearson's correlation) of 102 mChIP baits associated with 724 associated preys. The linear color gradient of the associated protein corresponds to the number of peptides detected by LC-MS/MS analysis following mChIP. Clustering and heat map generations were performed using the Multiple Experiment Viewer (www.tm4.org/mev.html). (B) mChIP preys tend to be expressed at a lower level than non-specific mChIP binders. The expression levels of mChIP preys and of non-specific mChIP binders were obtained from reference (Ghaemmaghami et al, 2003) and binned in three categories (low, medium and high expression level). (C) Most preys are observed at low frequencies by mChIP-MS. The mChIP abundance factor of each prey was determined, binned and plotted in a bar graph (blue bars). The percentage of total preys as a function of mChIP abundance factor is also plotted (red line). (D) mChIP analysis increases the number of protein associations detected for the majority of the baits that were tested. The data generated for 110 baits by mChIP-MS (blue bars) and TAP-MS (Gavin et al, 2006; Krogan et al, 2006) (red bars) were compiled, binned, and used to generate a bar graph. (E) mChIP-MS improves the characterization of baits with low and high expression levels. The difference in the number of protein associations between mChIP-MS and TAP-MS was determined and plotted against the bait expression levels obtained from reference (Ghaemmaghami et al, 2003).
Figure 3
Figure 3
The chromatin-associated interactome is a diverse landscape. (A) The Hap2 cluster contains the Hap2/Hap3/Hap5 heterotrimer and other transcriptional co-activators involved in regulating nitrogen usage. (B) Analysis of the Hap2 interactome by mChIP-MS, TAP-MS and AP-MS. The overlap between the proteins associated with Hap2 by mChIP-MS, TAP-MS and AP-MS (Supplementary Table S6) is shown. The cellular localization of Hap2 interaction partners was determined from reference (Huh et al, 2003) and displayed in pie charts. (C) A cluster of stress-activated transcriptional activators containing the Msn2/Msn4 transcription factors and their transcriptional co-activators. SAGA, TFIID and NuA4 protein complexes subunits are shown. (D) Spindle pole body cluster based on mChIP of Cnm67, Spc72, Bub2 and Spc24. (E) Crp1 cluster includes numerous genes involved in glycogen metabolism.
Figure 4
Figure 4
Five cell cycle regulators are observed to be part of a dense network of chromatin associated proteins. Cytoscape (Shannon et al, 2003) was used to visualize the network of preys associated with five transcription factors (Azf1, Mbp1, Mcm1, Swi4 and Swi6) by TAP-MS (Gavin et al, 2006; Krogan et al, 2006), mChIP-MS (this study) or both. The large nodes represent the bait used for AP-MS experiments, whereas the small nodes are the associated preys. In addition, some well-characterized large complexes were manually collapsed into rectangles to simplify the network. The edge color corresponds to the source of the association, and the node color corresponds to protein molecular function curated from the Saccharomyces genome database.
Figure 5
Figure 5
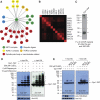
Cpr1 is a protein hub associated with nutrient sensing, cell division and silencing. (A) Proteins associated with Cpr1 were visualized using Cytoscape and arranged based on their known molecular functions manually. (B) Close-up view of a subsection of the bait–bait cluster (Figure 1C) related to Cpr1. (C) Approximately 1% of the Cpr1-TAP mChIP purified sample was resolved on a 8% Bis-Tris gel, transferred onto nitrocellulose, and immunoblotted against the TAP tagged. The arrow indicates the location of Cpr1-TAP, and the asterisks mark potential ubiquitinated Cpr1-TAP. Cpr1 is ubiquitinated in response to cellular stress (D) in a lge1/bre1/rad6-dependent manner (E). TCA extracted WCL from the indicated samples were resolved on a 4–12% NuPAGE gradient gel with MES buffer, transferred onto nitrocellulose and immunoblotted for the TAP tag, histone H3 and histone H3K4Me3. H3K4Me3 is used as a control in this experiment, as deletion of lge1, bre1 or rad6 has been reported to result in the lost of this histone modification (Hwang et al, 2003). The higher molecular bands observed for Cpr1 correspond to mono- and polyubiquitinated Cpr1 as marked and are not detected in a strain that cannot form polyubiquitin chains (Supplementary Figure S9).
Figure 6
Figure 6
Dissection of the physical associations between histone H3/H4 chaperones by mChIP. (A) Rtt106, HIR and Asf1 are physically associated. mChIP purifications from the indicated strains were performed as per Materials and methods section, and the purified proteins were resolved on a 4–12% NuPAGE gradient gel with MES buffer and stained with Colloidal blue. Each sample was in-gel digested with trypsin and analyzed by LC-MS/MS. The number of peptides detected by LC-MS/MS in each mChIP sample for HIR, Rtt106, Asf1, CAF-1 and Pol30 are reported. (B) The Rtt106–HIR association requires ASF1. Immunoblotting against the TAP, myc tag, actin or H3K56Ac were performed from the appropriate mChIP purifications or from WCL of the indicated strains following 8% SDS–PAGE gel (TAP, myc and actin WB) or 15% SDS–PAGE gel (H3K56Ac WB). (C) Rtt106 association with Asf1 is dependent on H3/H4 dimers, but is independent of the presence of DNA. The appropriate strains were grown in SC–TRP media and subjected to mChIP in the presence or absence of benzonase, a promiscuous DNase and RNase, to determine the interaction dependency on DNA. The purified materials or WCL were resolved on 8 or 15% SDS–PAGE gel and immunoblotted against TAP, myc, H3 and H3K56Ac as indicated. (D) Hir1 association with Asf1 is independent of the presence of histones or DNA. Hir1-TAP mChIP were performed as per Figure 6C.
Figure 7
Figure 7
H3K56Ac influence Rtt106 interactions with Asf1 and Rtt106 binding to the HTA1-HTB1 promoter. The Asf1–Rtt106 association is reduced in strains lacking H3K56Ac. (A) mChIP purifications of Asf1-TAP from the indicated background were performed, and 90% of the purified proteins were resolved on a 4–12% NuPAGE gel with MES buffer and then stained with Colloidal blue. Approximately 1% of the purified proteins or WCL were resolved on a 15% SDS–PAGE gel and immunoblotted for TAP, H3 or H3K56Ac. (B) The number of peptides detected by LC-MS/MS for Asf1, Rtt106 and HIR subunits are shown for each sample mChIP in Figure 6A. See Supplementary Table S6 for complete MS data. (C) Schematics of the HTA1-HTB1 divergent promoter and of the five PCR primer pairs used in this study. (D) Rtt106 binding to the HTA1-HTB1 promoter is influenced by the H3K56Ac mark. Rtt106-TAP ChIP from a WT or rtt109 background were performed as per Materials and methods section. Top bands correspond to a region of the HTA1-HTB1 locus, whereas the bottom bands are from an untranscribed region of chromosome V. (E) Rtt106 binding to region ‘C’ of the HTA1-HTB1 promoter is reduced, but not abrogated in the absence of the H3K56Ac mark. Rtt106 ChIP from the indicated strains were performed as per Figure 7D.

References

    1. Adkins MW, Williams SK, Linger J, Tyler JK (2007) Chromatin disassembly from the PHO5 promoter is essential for the recruitment of the general transcription machinery and coactivators. Mol Cell Biol 27: 6372–6382 - PMC - PubMed
    1. Akiyoshi B, Nelson CR, Ranish JA, Biggins S (2009) Quantitative proteomic analysis of purified yeast kinetochores identifies a PP1 regulatory subunit. Genes Dev 23: 2887–2899 - PMC - PubMed
    1. Alper BJ, Rowse JW, Schmidt WK (2009) Yeast Ste23p shares functional similarities with mammalian insulin-degrading enzymes. Yeast 26: 595–610 - PMC - PubMed
    1. Arad M, Benson DW, Perez-Atayde AR, McKenna WJ, Sparks EA, Kanter RJ, McGarry K, Seidman JG, Seidman CE (2002) Constitutively active AMP kinase mutations cause glycogen storage disease mimicking hypertrophic cardiomyopathy. J Clin Invest 109: 357–362 - PMC - PubMed
    1. Barski A, Cuddapah S, Cui K, Roh TY, Schones DE, Wang Z, Wei G, Chepelev I, Zhao K (2007) High-resolution profiling of histone methylations in the human genome. Cell 129: 823–837 - PubMed

Publication types

MeSH terms