. 2010 Dec 21:6:450.
doi: 10.1038/msb.2010.106.

Defining the transcriptome and proteome in three functionally different human cell lines

Affiliations

Defining the transcriptome and proteome in three functionally different human cell lines

Emma Lundberg et al. Mol Syst Biol. .

Abstract

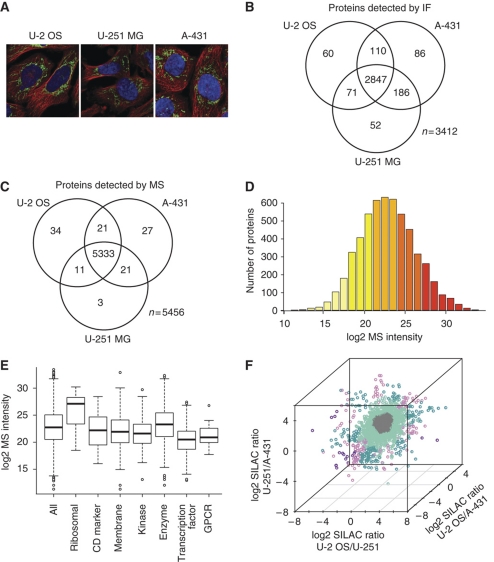
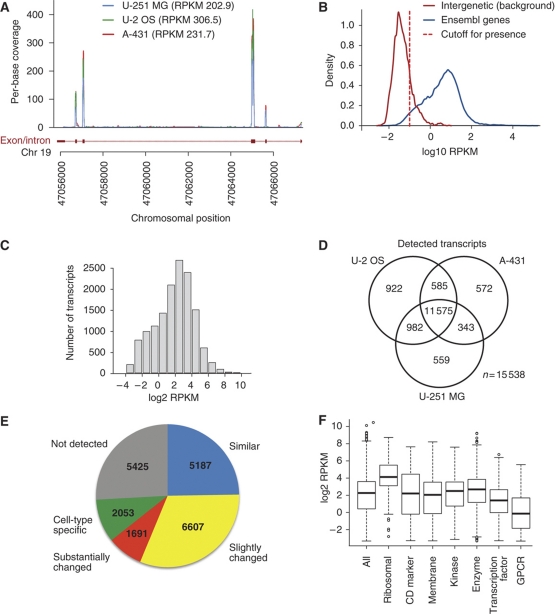
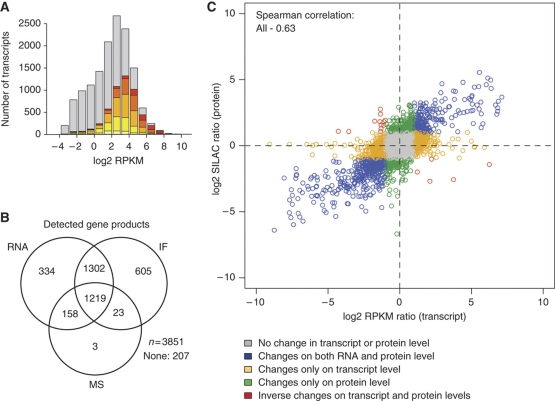
An essential question in human biology is how cells and tissues differ in gene and protein expression and how these differences delineate specific biological function. Here, we have performed a global analysis of both mRNA and protein levels based on sequence-based transcriptome analysis (RNA-seq), SILAC-based mass spectrometry analysis and antibody-based confocal microscopy. The study was performed in three functionally different human cell lines and based on the global analysis, we estimated the fractions of mRNA and protein that are cell specific or expressed at similar/different levels in the cell lines. A highly ubiquitous RNA expression was found with >60% of the gene products detected in all cells. The changes of mRNA and protein levels in the cell lines using SILAC and RNA ratios show high correlations, even though the genome-wide dynamic range is substantially higher for the proteins as compared with the transcripts. Large general differences in abundance for proteins from various functional classes are observed and, in general, the cell-type specific proteins are low abundant and highly enriched for cell-surface proteins. Thus, this study shows a path to characterize the transcriptome and proteome in human cells from different origins.


Conflict of interest statement

The authors declare that they have no conflict of interest.

Figures

Figure 1
Figure 1
The protein profiles in the three human cell lines based on confocal microscopy and mass spectrometry analysis. The numbers of analyzed and detected genes for each platform are shown in Supplementary Table 1. (A) The three cell lines used in the study: U-2 OS, U-251 MG and A-431 illustrated by confocal immunofluorescent images, where the microtubules (red), nuclei (blue) and an antibody (HPA024087) toward the human TUFM are staining mitochondria (green). (B) Venn diagram showing the number of proteins (%) detected by confocal IF in each cell line and the overlap between the cell lines. (C) Venn diagram showing the number of proteins detected by MS in each cell line and the overlap between the cell lines. (D) Distribution of log2 MS intensity for all detected proteins (n=5405) in U-2 OS. Bars are colored according to MS intensity, ranging from light yellow (low MS intensity) to dark red (high MS intensity). (E) The distribution of log2 MS intensity values for the protein categories (see Supplementary Table 2 for details) in U-2 OS. (F) Three-dimensional plot of log2 protein (SILAC) ratios between two cell lines performed for all three combinations. The genes are colored by the variation of expression between the three cell lines as: similar (less than two-fold difference between all cell lines in gray), slightly changed (two- to four-fold difference between two cell lines in light turquoise or between all cell lines in light purple) or substantially changed (more than four-fold difference between two cell lines in dark turquoise or between all cell lines in dark purple).
Figure 2
Figure 2
The transcript profiles in the three human cell lines based on RNA sequencing (RNA-seq). (A) RNA-seq reads mapping to a part of the RPS19 gene (ENSG00000105372). The reads align almost exclusively to the exons of the gene. (B) Distribution of RPKM values for all protein-coding genes (blue) and a set of ≈3000 intergenic regions defined as a genomic region at least 1 kb away from a known gene or EST. To detect present genes, we used a RPKM cutoff value of 0.1 (red dashed line), which corresponds to false-positive and false-negative rates of 5% (Supplementary Figure S1). (C) Distribution of log2 RPKM values for all detected transcripts (n=14 064) in U-2 OS. (D) Venn diagram showing the number of transcripts detected by RNA-seq in each cell line and the overlap between the cell lines. (E) The number of genes present in the categories ‘similar', ‘slightly changed', ‘substantially changed', ‘cell-type specific' and ‘not detected'. (F) Distribution of log2 RPKM values for all transcripts detected in protein categories (see Supplementary Table 3 for details) in U-2 OS.
Figure 3
Figure 3
Comparative analysis of RNA and protein profiles. (A) Comparative analysis of the number of proteins detected by MS and RNA-seq in U-2 OS, respectively. Transcripts also detected at the protein level are colored according to the MS intensity as shown in Figure 1D. The data for A-431 and U-251 MG are presented in Supplementary Figures S2 and S3, respectively. (B) Venn diagram showing the overlap in gene products between the three methods for all genes studied by all three methods (n=3851) in U-251 MG cells. The overlap for the three methods in A-431 and U-2 OS cells is presented in Supplementary Figure S4. (C) Correlation between changes on protein (log2 SILAC ratio) and transcript levels (log2 RPKM ratio) for U-2 OS over A-431 cells. A two-fold change between the cell lines was used as cutoff for up-/down-regulation on RNA and protein levels. Data for the changes between the other cell lines are presented in Supplementary Figure S6. The Spearman correlation for randomized RNA and protein pairs is zero for all cell lines (Supplementary Figure S7). The correlation between RPKM and MS intensity levels are presented in Supplementary Figure S8.

References

    1. Ashburner M, Ball CA, Blake JA, Botstein D, Butler H, Cherry JM, Davis AP, Dolinski K, Dwight SS, Eppig JT, Harris MA, Hill DP, Issel-Tarver L, Kasarskis A, Lewis S, Matese JC, Richardson JE, Ringwald M, Rubin GM, Sherlock G (2000) Gene ontology: tool for the unification of biology. The Gene Ontology Consortium. Nat Genet 25: 25–29 - PMC - PubMed
    1. Barbe L, Lundberg E, Oksvold P, Stenius A, Lewin E, Bjorling E, Asplund A, Ponten F, Brismar H, Uhlen M, Andersson-Svahn H (2008) Toward a confocal subcellular atlas of the human proteome. Mol Cell Proteomics 7: 499–508 - PubMed
    1. Berglund L, Bjorling E, Oksvold P, Fagerberg L, Asplund A, Szigyarto CA, Persson A, Ottosson J, Wernerus H, Nilsson P, Lundberg E, Sivertsson A, Navani S, Wester K, Kampf C, Hober S, Ponten F, Uhlen M (2008) A genecentric Human Protein Atlas for expression profiles based on antibodies. Mol Cell Proteomics 7: 2019–2027 - PubMed
    1. Birney E, Stamatoyannopoulos JA, Dutta A, Guigo R, Gingeras TR, Margulies EH, Weng Z, Snyder M, Dermitzakis ET, Thurman RE, Kuehn MS, Taylor CM, Neph S, Koch CM, Asthana S, Malhotra A, Adzhubei I, Greenbaum JA, Andrews RM, Flicek P et al. (2007) Identification and analysis of functional elements in 1% of the human genome by the ENCODE pilot project. Nature 447: 799–816 - PMC - PubMed
    1. Bjorling E, Uhlen M (2008) Antibodypedia, a portal for sharing antibody and antigen validation data. Mol Cell Proteomics 7: 2028–2037 - PubMed

Publication types