. 2011 Jun;31(6):1403-11.
doi: 10.1038/jcbfm.2010.228. Epub 2010 Dec 22.

Arterial spin labeling and dynamic susceptibility contrast CBF MRI in postischemic hyperperfusion, hypercapnia, and after mannitol injection

Affiliations

Arterial spin labeling and dynamic susceptibility contrast CBF MRI in postischemic hyperperfusion, hypercapnia, and after mannitol injection

Yoji Tanaka et al. J Cereb Blood Flow Metab. 2011 Jun.

Abstract

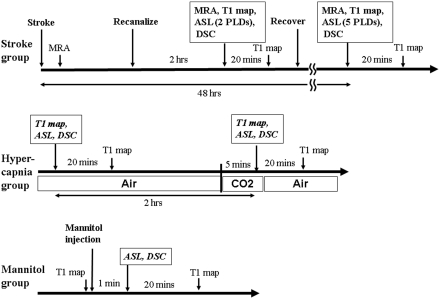
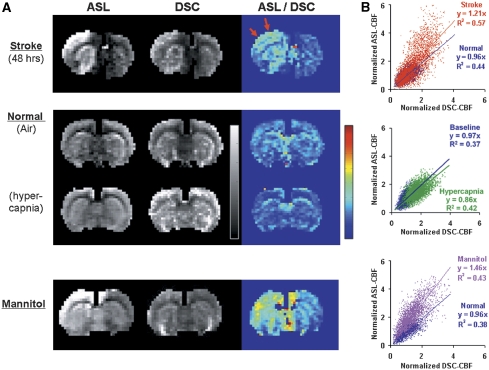
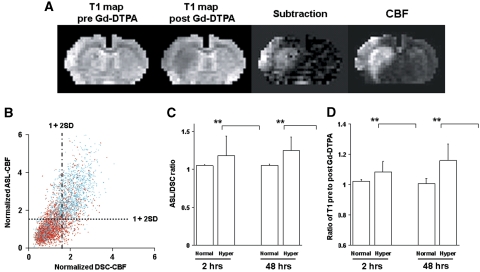
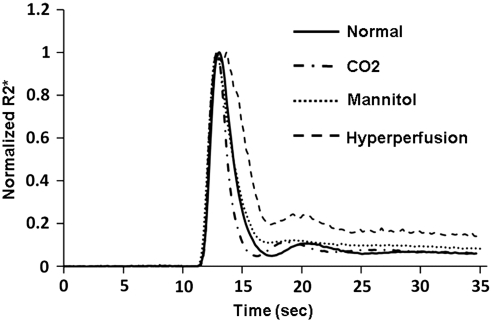
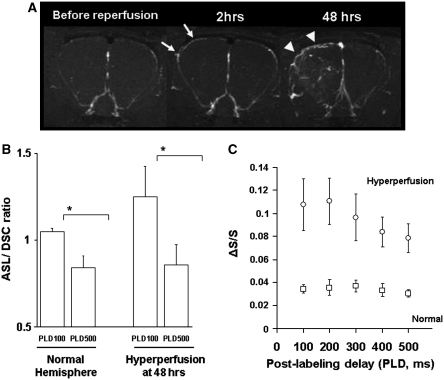
Arterial spin labeling (ASL) and dynamic susceptibility contrast (DSC) magnetic resonance imaging (MRI) are widely used to image cerebral blood flow (CBF) in stroke. This study examined how changes in tissue spin-lattice relaxation-time constant (T(1)), blood-brain barrier (BBB) permeability, and transit time affect CBF quantification by ASL and DSC in postischemic hyperperfusion in the same animals. In Group I (n=6), embolic stroke rats imaged 48 hours after stroke showed regional hyperperfusion. In normal pixels, ASL- and DSC-CBF linearly correlated pixel-by-pixel. In hyperperfusion pixels, ASL-CBF was significantly higher than DSC-CBF pixel-by-pixel (by 25%). T(1) increased from 1.76±0.14 seconds in normal pixels to 1.93±0.17 seconds in hyperperfusion pixels. Arterial transit time decreased from 300 milliseconds in normal pixels to 200 milliseconds in hyperperfusion pixels. ΔR(2)(*) profiles showed contrast-agent leakages in the hyperperfusion regions. In Group II (n=3) in which hypercapnic inhalation was used to increase CBF without BBB disruption, CBF increased overall but ASL- and DSC-CBF remained linearly correlated. In Group III (n=3) in which mannitol was used to break the BBB, ASL-CBF was significantly higher than DSC-CBF. We concluded that in normal tissue, ASL and DSC provide comparable quantitative CBF, whereas in postischemic hyperperfusion, ASL-CBF and DSC-CBF differed significantly because ischemia-induced changes in T(1) and BBB permeability affected the two methods differently.


Figures

Figure 1
Figure 1
Schematic drawings of the magnetic resonance imaging (MRI) protocols used in the three experimental groups.
Figure 2
Figure 2
(A) Arterial spin labeling (ASL) cerebral blood flow (CBF) image, dynamic susceptibility contrast (DSC) CBF image, and ASL:DSC ratio maps from one animal of each of the three experimental groups. In the stroke animal (top row), the stroke lesion shows hyperperfusion. ASL yields a higher CBF than DSC. In the hypercapnia animal (middle row), CBF increases globally. ASL- and DSC-CBF maps show similar increases. In normal animal injected with mannitol (bottom row), CBF increases in the affected hemisphere. ASL yields a higher CBF increase than DSC. (B) Normalized ASL versus DSC CBF scatterplots for all animals in each of the three experimental groups. The slopes of the normal hemispheres in all three groups were close to unity. The slopes of the stroke, hypercapnia, and mannitol group were 1.21, 0.86, and 1.46, respectively.
Figure 3
Figure 3
(A) T1 maps before and after Gd-DTPA intravenous injection, subtraction image, and arterial spin labeling cerebral blood flow (ASL-CBF) map of a representative stroke rat. Hyperintensity on the subtraction image indicates Gd-DTPA leakage, which corresponds well to the area of increased CBF. (B) Normalized ASL (postlabeling delay (PLD)=100) versus dynamic susceptibility contrast (DSC) CBF scatterplots of stroke group obtained at 48 hours after stroke. Pixels with ratio of T1 pre- to post-Gd-DTPA greater than mean T1+2 s.d. of contralateral normal pixels are displayed as blue dots. Normal T1 pixels of the stroke hemisphere are shown as red dots. (C) Group-averaged ASL:DSC CBF ratios of the normal and the hyperperfusion pixels at 2 and 48 hours after stroke onset (PLD=100). The ratio was larger in the hyperperfusion territory. (D) Group-averaged ratios of T1 before and after Gd-DTPA from the normal and the hyperperfusion pixels at 2 and 48 hours after stroke. The ratio was also larger in the hyperperfusion territory.
Figure 4
Figure 4
Normalized ΔR2* time courses for three experimental groups. The traces from the normal and hypercapnia group returned close to baseline after bolus gadopentetate dimeglumine (Gd-DTPA) injection. The mannitol group shows a slight elevation post-Gd-DTPA. In contrast, trace from the hyperperfusion pixels remains significantly elevated above baseline.
Figure 5
Figure 5
(A) Magnetic resonance angiography (MRA) of a stroke rat imaged before, 2 and 48 hours after recanalization. Recanalization was detected at 2 hours (arrows). Additional vessels were highly perfused at 48 hours (arrow heads). (B) Group-averaged arterial spin labeling to dynamic susceptibility contrast (ASL:DSC) cerebral blood flow (CBF) ratio of the hyperperfusion pixels and contralateral normal pixels of middle cerebral artery area at postlabeling delays (PLDs) of 100 and 500 milliseconds. ASL:DSC ratio decreases with increasing PLD. (C) ΔS/S versus PLD in the normal and hyperperfusion area. The ΔS/S of the hyperperfusion pixels peaked at PLD of 200 milliseconds and the ΔS/S of normal pixels peaked at PLD of 300 milliseconds. *P<0.05.

References

    1. Alsop DC, Detre JA. Reduced transit-time sensitivity in noninvasive magnetic resonance imaging of human cerebral blood flow. J Cereb Blood Flow Metab. 1996;16:1236–1249. - PubMed
    1. Calamante F, Gadian DG, Connelly A. Delay and dispersion effects in dynamic susceptibility contrast MRI: simulations using singular value decomposition. Magn Reson Med. 2000;44:466–473. - PubMed
    1. Chalela JA, Alsop DC, Gonzalez-Atavales JB, Maldjian JA, Kasner SE, Detre JA. Magnetic resonance perfusion imaging in acute ischemic stroke using continuous arterial spin labeling. Stroke. 2000;31:680–687. - PubMed
    1. Detre JA, Leigh JS, Williams DS, Koretsky AP. Perfusion imaging. Magn Reson Med. 1992;23:37–45. - PubMed
    1. Donahue KM, Krouwer HG, Rand SD, Pathak AP, Marszalkowski CS, Censky SC, Prost RW. Utility of simultaneously acquired gradient-echo and spin-echo cerebral blood volume and morphology maps in brain tumor patients. Magn Reson Med. 2000;43:845–853. - PubMed

Publication types