. 2011 Mar 24;471(7339):480-5.
doi: 10.1038/nature09725. Epub 2010 Dec 22.

Comprehensive analysis of the chromatin landscape in Drosophila melanogaster

Affiliations

Comprehensive analysis of the chromatin landscape in Drosophila melanogaster

Peter V Kharchenko et al. Nature. .

Abstract

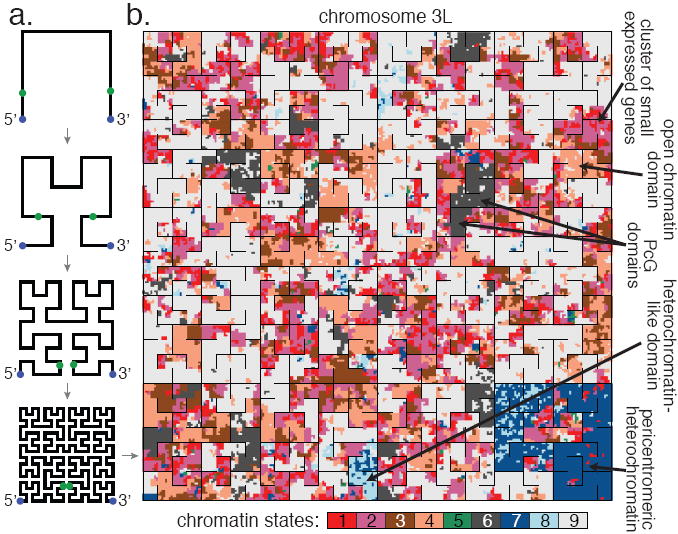
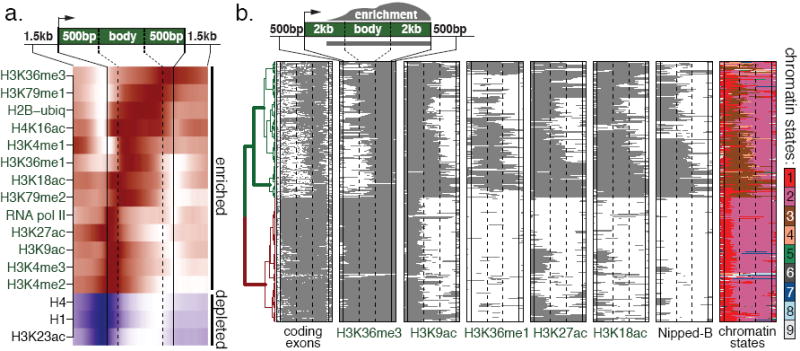
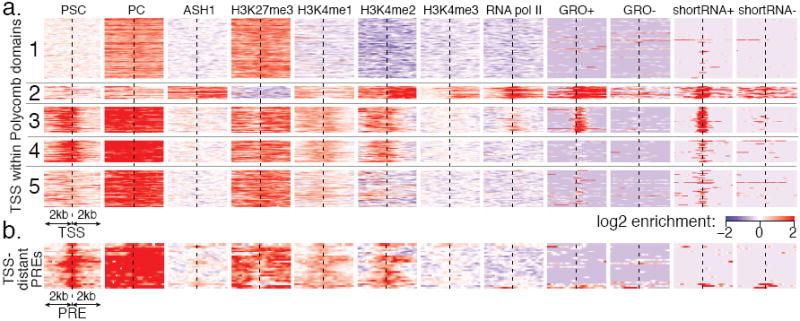
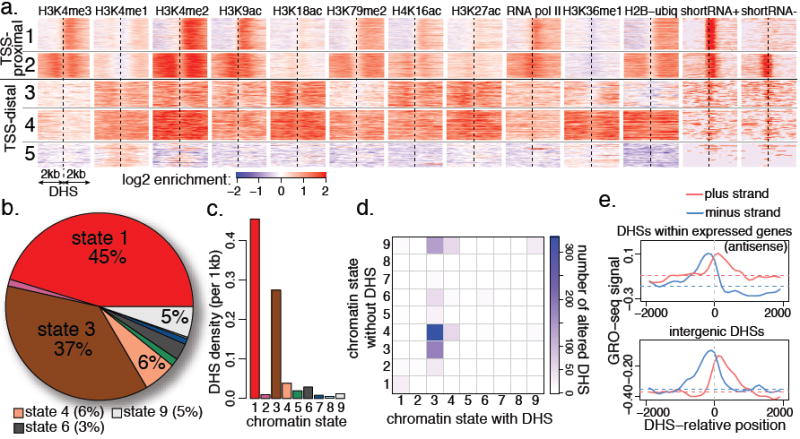
Chromatin is composed of DNA and a variety of modified histones and non-histone proteins, which have an impact on cell differentiation, gene regulation and other key cellular processes. Here we present a genome-wide chromatin landscape for Drosophila melanogaster based on eighteen histone modifications, summarized by nine prevalent combinatorial patterns. Integrative analysis with other data (non-histone chromatin proteins, DNase I hypersensitivity, GRO-Seq reads produced by engaged polymerase, short/long RNA products) reveals discrete characteristics of chromosomes, genes, regulatory elements and other functional domains. We find that active genes display distinct chromatin signatures that are correlated with disparate gene lengths, exon patterns, regulatory functions and genomic contexts. We also demonstrate a diversity of signatures among Polycomb targets that include a subset with paused polymerase. This systematic profiling and integrative analysis of chromatin signatures provides insights into how genomic elements are regulated, and will serve as a resource for future experimental investigations of genome structure and function.


Conflict of interest statement

Author information The data are available from modENCODE site: http://www.modencode.org. GRO-seq data is available from Gene Expression Omnibus (GEO GSE25321). The authors declare no competing financial interests.

Figures

Figure 1
Figure 1. Chromatin annotation of the Drosophila melanogaster genome
a. A 9-state model of prevalent chromatin states found in S2 and BG3 cells. Each chromatin state (row) is defined by a combinatorial pattern of enrichment (red) or depletion (blue) for specific chromatin marks (first panel, columns). For instance, state 1 is distinguished by enrichment in H3K4me2/me3 and H3K9ac, typical of transcription start sites (TSS) in expressed genes. The enrichments/depletions are shown relative to chromatin input S2 data shown, see (Supp. Figure 3 for BG3 data and histone density normalization). The second panel shows average enrichment of chromosomal proteins. The third panel shows fold over/under-representation of genic and TSS-proximal (±1kb) regions relative to the entire tiled genome. The enrichment of intronic regions is relative to genic regions associated with each state. b. A genome-wide karyotype view of the domains defined by the 9-state model in S2 cells. Centromeres are shown as open circles, and dashed lines span gaps in the genome assembly. Several prominent chromatin organization features are illustrated (color code in a), including the extent of pericentromeric heterochromatin (state 7), and the H4K16ac-driven signature of the dosage-compensated male X chromosome (state 5). (BG3 genome in Supp. Figure 4.) c-e. Examples of chromatin annotation at specific loci. c. Two distinct chromatin signatures of transcriptionally active genes: one (left) is associated with enrichment in marks of states 3 and 4, while the other (right) is limited to states 1 and 2, recapitulating well-established TSS and elongation signatures (note: small patches of state 7 in CG13185 illustrate H3K9me2 found at some expressed genes in S2 cells16). d. A locus containing two Polycomb-associated domains, silent (left) and balanced (right). e. A large state 8 domain located within euchromatic sequence in BG3 cells, enriched for chromatin marks typically associated with heterochromatic regions, but at lower levels than in pericentromeric heterochromatin (state 7).
Figure 2
Figure 2. Visualization of spatial scales and organization using compact folding
a. The chromosome is folded using a geometric pattern (Hilbert space-filling curve) that maintains spatial proximity of nearby regions. An illustration of the first four folding steps is shown. Note that while this compact curve is optimal for preserving proximity relationships, some distal sites appear adjacent along the fold axis (green dots). b. Chromosome 3L in S2 cells. A domain of a given chromatin state appears as a patch of uniform color of corresponding size. Thin black lines are used to separate regions that are distant on the chromosome. The folded view illustrates chromatin organization features that are not easily discerned from a linear view: active TSSs (state 1) appear as small specks surrounded by elongation state 2, commonly next to larger regions marked by H3K36me1-driven state 4, which also contains patches of intron-associated state 3. These open chromatin regions are separated by extensive domains of state 9. See Supp. Figures 6,7 for other chromosomes and BG3 data. The folded views can be browsed alongside the linear annotations and other relevant data online: http://compbio.med.harvard.edu/flychromatin.
Figure 3
Figure 3. Chromatin patterns associated with transcriptionally active genes
a. Location and extent of chromatin features relative to boundaries of expressed genes (>1kb) in BG3 cells. The color intensity indicates the relative frequency of enrichment/depletion of a given mark within the gene (normalized independently for each mark). b. Regions enriched for ‘active’ chromatin marks in long transcribed genes. The plot shows the extent of regions enriched for various active marks at transcriptionally-active genes (>4kb) on BG3 autosomes. Each row represents a scaled gene. The first column illustrates coding exons; the last column shows chromatin state annotation. The clustering of the genes according to the spatial patterns of chromatin marks separates genes with a high fraction of coding sequence (red subtree, bottom) from genes containing long introns (green subtrees, top), which are associated with chromatin state 3 (last column) and binding of specific chromosomal proteins, such as Nipped-B (also see Supp. Figure 13).
Figure 4
Figure 4. Signatures of TSSs within domains of Polycomb-mediated repression
a. Distinct classes of TSSs in S2 cell Polycomb domains. Each row represents a TSS. Clusters 1-5 illustrate distinct TSS states (see Supp. Figure 21 for complete set of clusters). Cluster 1 shows fully repressed TSSs with the expected pattern of PC and H3K27me3 enrichment; cluster 2 shows 21 TSSs found within ASH1 domains, maintained in a “balanced” state. Clusters 3 and 4 distinguish TSSs located in the immediate proximity of Polycomb response elements (PREs), showing the symmetric H3K4me1/me2 enrichment typical of all PREs. Many such TSSs (cluster 3, 42 TSSs) produce short, non-polyadenylated transcripts along the sense strand (GRO+/shortRNA+ columns), indicating the presence of paused polymerase. b. PRE positions distant from annotated TSSs. TSS-distal PREs exhibit enrichment for H3K4me1/me2, but are not associated with GRO or shortRNA signatures.
Figure 5
Figure 5. Chromatin signatures of regulatory elements identified by DNaseI hypersensitivity
a. Representative classes of high-magnitude DNaseI hypersensitive sites (DHSs) and chromatin signatures in S2 cells. TSS-proximal (within 2kb) DHSs show chromatin signatures expected of expressed gene promoters : high H3K4me3 and RNA pol II signal extending in the direction of transcription (left to right; cluster 2 groups bidirectional promoters). TSS-distal DHSs are associated with high H3K4me1 and low H3K4me3 levels. Most TSS-distal DHSs found within the bodies of expressed genes (clusters 3, 4) are associated with chromatin state 3. A cluster of rare intergenic DHSs (cluster 5) is associated with localized peaks of H3K4me1/2 (complete sets of clusters in Supp. Figures 25,26,28). b. Distribution of DHS positions among chromatin states. The vast majority of DHSs are found within the TSS-proximal state 1 or enhancer-like state 3 regions. c. States 1 and 3 exhibit the highest density of DHSs. d. Cell line-specific DHSs are positioned predominantly within the enhancer-like state 3. The transition matrix shows the chromatin state of loci containing DHSs in one cell line (x-axis), and the state of the same locus in the other cell line where the DHS is absent (y-axis). Most of the DHSs that differ between cell lines originate from state 3. When DHSs are absent, the loci typically transition to an open chromatin state 4 (43%), or maintain state 3 (23%). In both scenarios, most of the associated genes remain transcriptionally active (see Supp. Figure 34). e. Low levels of engaged RNA polymerase are associated with TSS-distal DHSs. The top plot shows the local increase in the antisense GRO-seq signal for DHSs located within transcribed genes; dashed lines show median levels. Intergenic DHS positions (bottom plot) also show bi-directional GRO-seq signal of comparable magnitude. See Supp. Figures 29,27,30.
Figure 6
Figure 6. Spatial arrangements of chromatin states associated with active transcription
Unlike short or exon-rich expressed genes, expressed genes with long intronic regions commonly contain one or more regions of enhancer-like state 3, associated with specific chromosomal proteins, high nucleosome turnover and DHSs displaying cell-type plasticity.

Comment in

References

    1. modENCODE et al. Identification of functional elements and regulatory circuits by Drosophila modENCODE. Science. in press. - PMC - PubMed
    1. Gerstein MB, et al. Integrative Analysis of the Caenorhabditis elegans Genome by the modENCODE Project. Science. in press. - PMC - PubMed
    1. Adams MD, et al. The genome sequence of Drosophila melanogaster. Science. 2000;287:2185–2195. - PubMed
    1. Clark AG, et al. Evolution of genes and genomes on the Drosophila phylogeny. Nature. 2007;450:203–218. - PubMed
    1. Hoskins RA, et al. Sequence finishing and mapping of Drosophila melanogaster heterochromatin. Science. 2007;316:1625–1628. - PMC - PubMed

Publication types

MeSH terms

Associated data