. 2011 Mar;12(2):116-25.
doi: 10.1038/gene.2010.54. Epub 2010 Dec 23.

An autoimmune-associated variant in PTPN2 reveals an impairment of IL-2R signaling in CD4(+) T cells

Affiliations

An autoimmune-associated variant in PTPN2 reveals an impairment of IL-2R signaling in CD4(+) T cells

S A Long et al. Genes Immun. 2011 Mar.

Abstract

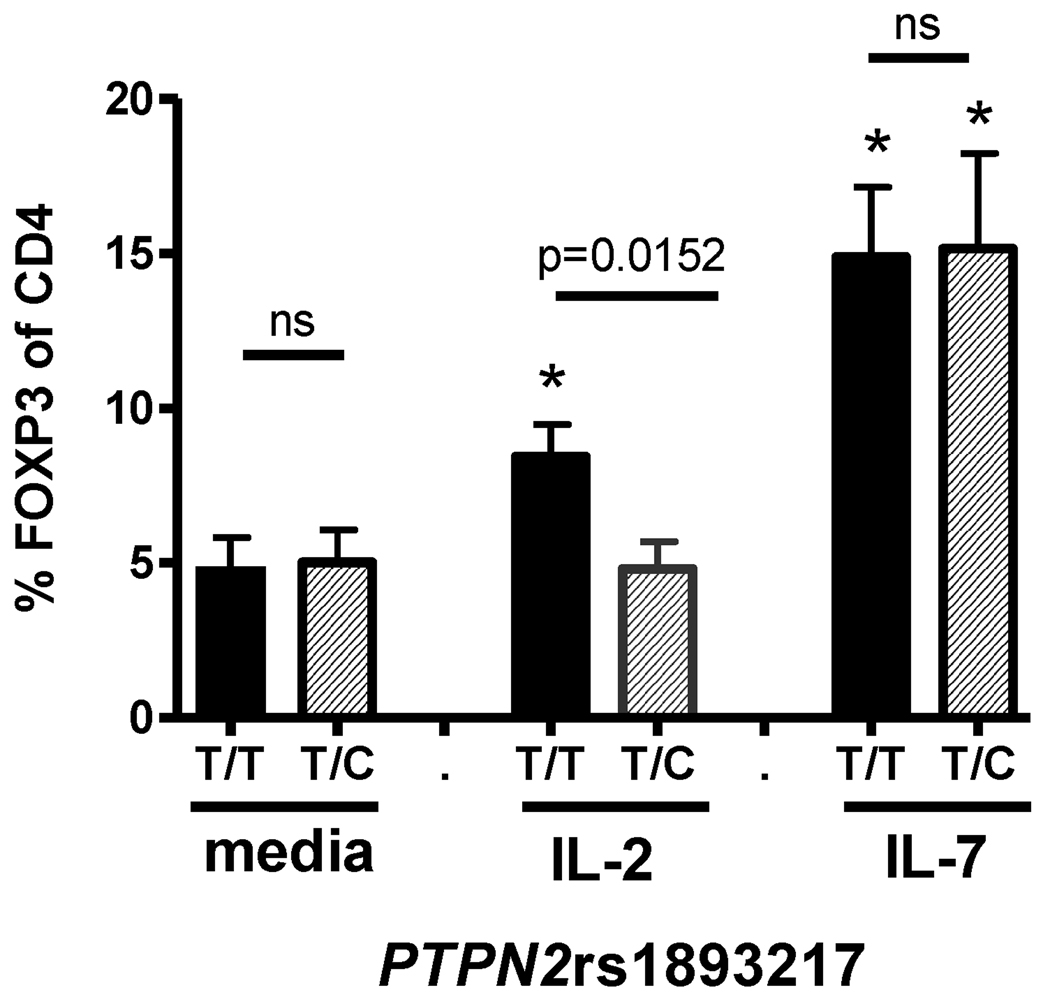
The IL-2/IL-2R signaling pathway has an important role in autoimmunity. Several genes identified in genome-wide association (GWA) studies encode proteins in the IL-2/IL-2R signaling cascade that are associated with autoimmune diseases. One of these, PTPN2, encodes a protein tyrosine phosphatase that is highly expressed in T cells and regulates cytokine signaling. An intronic risk allele in PTPN2, rs1893217(C), correlated with decreased IL-2R signaling in CD4(+) T cells as measured by phosphorylation of STAT5 (phosphorylated STAT5 (pSTAT5)). We modeled an additive single nucleotide polymorphism (SNP) genotype, in which each copy of the risk allele conferred a decrease in IL-2R signaling (P=4.4 × 10(-8)). Decreased pSTAT5 impacted IL-2Rβ chain signaling resulting in reduced FOXP3 expression in activated cells. This phenotype was not due to overt differences in expression of the IL-2R, molecules in the IL-2R signaling cascade or defects in STAT5. However, the rs1893217(C) risk variant did correlate with decreased PTPN2 expression in CD4(+)CD45RO T cells (P=0.0002). Thus, the PTPN2rs1893217(C) risk allele associated with reduced pSTAT5 in response to IL-2 and reduced PTPN2 expression. Together, these data suggest that decreased expression of PTPN2 may indirectly modulate IL-2 responsiveness. These findings, identified through genotype/phenotype relationships, may lead to identification of novel mechanisms underlying dysregulation of cytokine signaling in autoimmunity.


Conflict of interest statement

Conflict of interest: The authors declare no financial or commercial conflict of interest.

Figures

Figure 1
Figure 1. PTPN2rs1893217(C) risk allele is associated with decreased pSTAT5 in CD4+ T cells responding to IL-2
Thawed PBMC from control subjects were stimulated with IL-2 prior to fixation and staining for CD4, CD25, CD45RO and pSTAT5(Y694). Analysis was performed by gating on total live CD4+ T cells and pSTAT5+ cells were determined based on media alone conditions. (A) The frequency of CD4+CD25+ T cells and (B) CD4+CD45RO+ T cells that were pSTAT5(Y694)+ upon stimulation with 100 IU/ml IL-2 for 10min was determined for a subset of subjects stratified by PTPN2rs1893217 genotype. Symbols represent individual subjects and bars represent means. Statistical significance was determined by a two-sample student’s t-test. (C) The frequency of total CD4+ T cells that are pSTAT5(Y694)+ in response to different doses of IL-2 for 10min or 20min was determined for rs1893217 T/T(n=10), T/C(n=10) and C/C(n=4) control subjects. The average and standard deviation is shown for each group. An asterisk denotes significant difference from T/T homozygotes and heterozygotes using a two-sample student’s t-test. (D) A larger cohort of PTPN2rs1893217 T/T(n=40), T/C(n=26), and C/C(n=9) control subjects were stimulated with 100 IU/ml IL-2 for 10min and pSTAT5+ was determined for total CD4+ T cells. Association analysis of pSTAT5 upon exposure to IL-2 and PTPN2 genotype was performed using PLINK with an additive SNP genotype model using the “linear” command, adjusting for gender as a covariate (p=1.7×10⁻⁸, Wald’s z-test). (E) MFI Fold increase of total CD4+ T cells that are pSTAT5(Y694)+ in response to 100 IU/ml IL-2 for 10min was compared to no stimulation for samples stained with PE conjugated pSTAT5 antibody that are PTPN2rs1893217 T/T(n=24), T/C(n=21) and C/C(n=9). Boxes represent inter-quartile range (25%-75% of the samples), middle lines represent the median and lines represent the range of values. Statistical significance between individual genotypes was determined using a two-sample student’s t-test.
Figure 2
Figure 2. Reduced STAT5 phosphorylation in response to IL-2 in control subjects carrying the risk allele of PTPN2rs1893217(C) is a stable phenotype
Cells isolated from the same individual but at different dates were assayed as in Figure 1 with 100 IU/ml IL-2 for 10min. Sample collection varied from 5 months to 3.25 years. Samples assayed were representative of rs1893217(T/T), (T/C) and (C/C) subjects with mean pSTAT5 values of 34%, 19% and 10%, respectively. (A) Numbers on the x-axis represent PTPN2rs1893217(T/T) individuals, letters represent T/C individuals and Roman numerals represent C/C individuals. Number of months between sampling is noted in parentheses. The number of months between sampling and genotype did not correlate with SD or coefficient of variation as measured by linear regression while (B) values from the 1st sampling and 2nd sampling of the same subject directly correlated.
Figure 3
Figure 3. Decreased pSTAT5 in CD4+ T cells of control subjects carrying the rs1893217 risk allele of PTPN2 is linked to impaired IL-2Rβ chain signaling
The frequency of CD4+ T cells that are pSTAT5+ following stimulation for 10 min with 200pg/ml IL-15(n=15 and 10 for rs1893217(T/T) and (T/C) subjects, respectively) or 40pg/ml IL-7 (n=10 and 9 for (T/T) and (T/C) subjects, respectively) were determined as in Figure 1. Symbols represent individual subjects and bars represent means. Statistical significance was determined by a two-sample student’s t-test.
Figure 4
Figure 4. FOXP3 induction in the presence of IL-2 is impaired in control subjects carrying the risk allele of PTPN2rs1893217
CD4+CD25 T cells were isolated and activated with 5µg/ml anti-CD3 antibody and irradiated accessory cells as described in Materials and Methods in the presence of media alone, 100 IU/ml IL-2, or 10ng/ml IL-7. FOXP3 expression 48hrs following activation was determined by flow cytometry in PTPN2rs1893217(T/T)(n=17) and PTPN2rs1893217(T/C)(n=7) control subjects. An asterisk denotes significant difference from media alone using a paired student’s t-test. Bars represent means ± SEM. All control subjects in this experiment were homozygous for the risk allele of CD25rs41295061(C/C) and do not carry the PTPN22rs2476601 1858 C/T variant.
Figure 5
Figure 5. PTPN2rs1893217(C) risk allele correlates with decreased total PTPN2 RNA levels
PTPN2 RNA levels in CD4+CD45RO+ T lymphocytes from genotyped control subjects was assessed by QPCR for (A) Total PTPN2, (B) 45 kD splice variant, and (C) 48 kD splice variants. Array expression data was extracted for the HapMap CEU parent LCLs from the Sanger GeneVar website for (D) Total PTPN2 RNA, (E) 48kD splice variant RNA, and (F) GAPDH RNA. Ln transformed expression values were tested for association with PTPN2rs1893217 genotype using PLINK with an additive SNP genotype model using the “linear” command, adjusting for gender as a covariate. P values ≤0.017 are considered significant for CD4+CD45RO T cells and P values ≤0.025 are significant for LCLs.

References

    1. Sadlack B, Lohler J, Schorle H, Klebb G, Haber H, Sickel E, et al. Generalized autoimmune disease in interleukin-2-deficient mice is triggered by an uncontrolled activation and proliferation of CD4+ T cells. Eur J Immunol. 1995 Nov;25(11):3053–3059. - PubMed
    1. Suzuki H, Kundig TM, Furlonger C, Wakeham A, Timms E, Matsuyama T, et al. Deregulated T cell activation and autoimmunity in mice lacking interleukin-2 receptor beta. Science. 1995 Jun 9;268(5216):1472–1476. - PubMed
    1. Genome-wide association study of 14,000 cases of seven common diseases and 3,000 shared controls. Nature. 2007 Jun 7;447(7145):661–678. - PMC - PubMed
    1. Hakonarson H, Qu HQ, Bradfield JP, Marchand L, Kim CE, Glessner JT, et al. A novel susceptibility locus for type 1 diabetes on Chr12q13 identified by a genome-wide association study. Diabetes. 2008 Apr;57(4):1143–1146. - PubMed
    1. Todd JA, Walker NM, Cooper JD, Smyth DJ, Downes K, Plagnol V, et al. Robust associations of four new chromosome regions from genome-wide analyses of type 1 diabetes. Nat Genet. 2007 Jul;39(7):857–864. - PMC - PubMed

Publication types

MeSH terms

Substances