Review
. 2011 Jan;11(1):21-33.
doi: 10.1038/nri2903.

Imaging techniques for assaying lymphocyte activation in action

Affiliations
Review

Imaging techniques for assaying lymphocyte activation in action

Lakshmi Balagopalan et al. Nat Rev Immunol. 2011 Jan.

Abstract

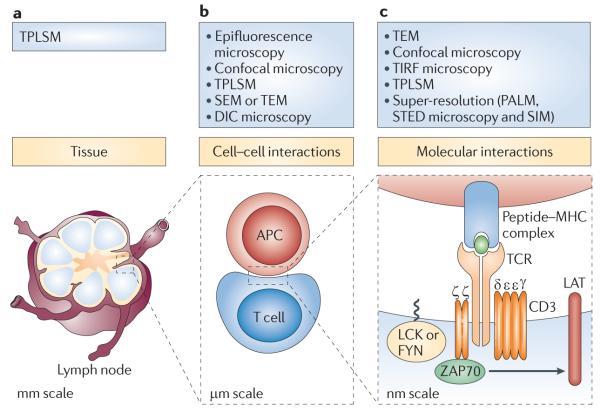
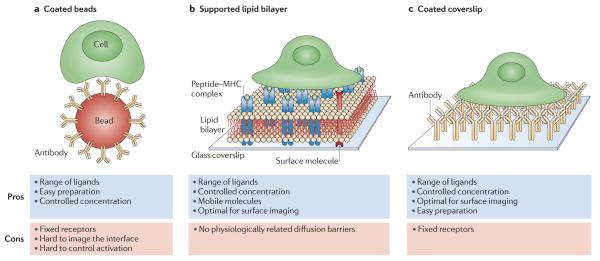
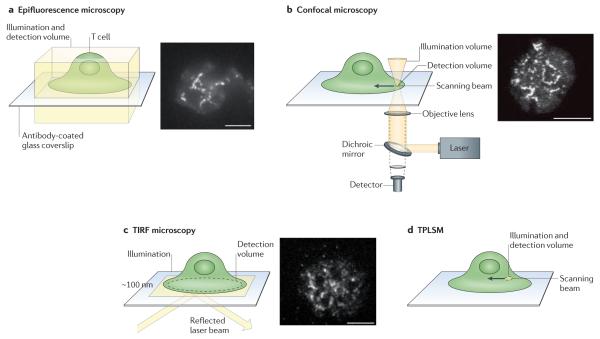
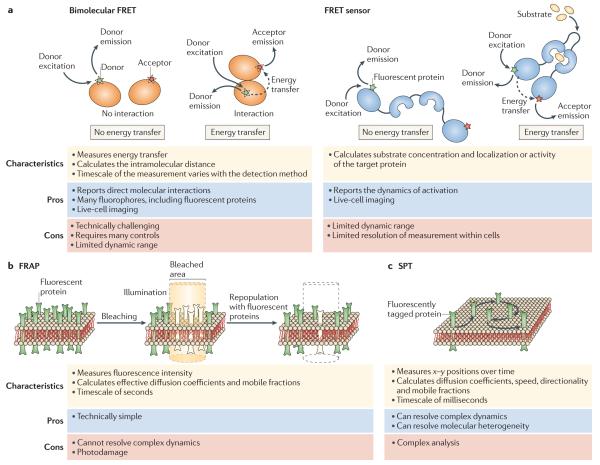
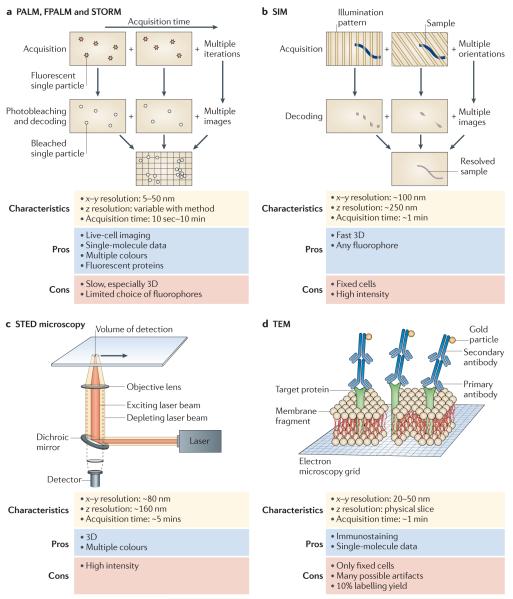
Imaging techniques have greatly improved our understanding of lymphocyte activation. Technical advances in spatial and temporal resolution and new labelling tools have enabled researchers to directly observe the activation process. Consequently, research using imaging approaches to study lymphocyte activation has expanded, providing an unprecedented level of cellular and molecular detail in the field. As a result, certain models of lymphocyte activation have been verified, others have been revised and yet others have been replaced with new concepts. In this article, we review the current imaging techniques that are used to assess lymphocyte activation in different contexts, from whole animals to single molecules, and discuss the advantages and potential limitations of these methods.


Figures

Figure 1
Figure 1. Imaging techniques: hierarchy of scale
The study of lymphocyte activation requires observation of samples that vary in size over six orders of magnitude. This figure shows the T cell receptor (TCR)-mediated signalling pathway and microscopy techniques used at three levels of sample size. a | In whole organisms or intact tissues, encounters between lymphocytes and antigen-presenting cells (APCs) can be studied in situ using two-photon laser scanning microscopy (TPLSM). The specimen size is tens of millimetres. b | Cell–cell interactions and many subcellular details can be monitored using a large number of conventional microscopy techniques. These samples are typically several micrometres in size, but some details are at the diffraction limit of light scale. c | To observe molecular detail, high- and super-resolution imaging techniques are required. The samples here are individual molecules, only a few nanometres in size. DIC, differential interference contrast; LAT, linker for activation of T cells; PALM, photoactivated localization microscopy; SEM, scanning electron microscopy; SIM, structured illumination microscopy; STED, stimulated emission depletion; TEM, transmission electron microscopy; TIRF, total internal reflection fluorescence; ZAP70, ζ-chain-associated protein kinase of 70kDa.
Figure 2
Figure 2. Antigen-presenting cell substitutes used for lymphocyte activation
Several model systems have been developed to enable lymphocyte imaging at improved resolution. These models use a surrogate substrate for activation instead of an antigen-presenting cell (APC). a | Beads, typically coated with stimulatory antibodies, can be easily prepared and customized but do not allow rapid imaging of cell activation. b | Supported lipid bilayers that incorporate peptide–MHC molecules and other molecules such as integrins provide a better surface for imaging. Although the molecules are mobile, the bilayer lacks diffusion barriers that may be present in real cells. c | Coverslips that are coated with stimulatory molecules, including peptide–MHC molecules and antibodies, also allow controlled concentrations of a wide range of ligands and optimal surface imaging. However, the bound molecules are immobile.
Figure 3
Figure 3. Light-microscopy techniques that are widely used for cell imaging
a | Epifluorescence microscopy. b | Confocal microscopy. c | Total internal reflection fluorescence (TIRF) microscopy. d | Two-photon laser scanning microscopy (TPLSM). Illumination is depicted in yellow and the detection volume is labelled. The images show fluorescent clusters of linker for activation of T cells (LAT) in Jurkat T cells activated on antibody-coated coverslips.
Figure 4
Figure 4. Techniques for imaging molecular dynamics and interactions
a | Fluorescent resonance energy transfer (FRET) occurs when a suitable donor is in close proximity to an acceptor fluorophore; the process is illustrated here by arrows showing donor excitation, donor emission, energy transfer and acceptor emission. For bimolecular FRET, synthetic fluorescent probes (green and red stars) or fluorescent proteins can be used, whereas FRET sensors primarily incorporate fluorescent proteins. See Supplementary Information S1 (box) for further details on FRET measurements. b | Fluorescence recovery after photobleaching (FRAP), showing fluorescent proteins in a region of membrane undergoing selective photobleaching, followed by the recovery of fluorescence in this area as a result of repopulation with unbleached mobile molecules. c | Single-particle tracking (SPT), showing a single fluorescently tagged molecule as it is tracked over time.
Figure 5
Figure 5. High-resolution imaging techniques
These techniques are needed to image cellular structures beyond the diffraction limit of light. a | Super-resolution light microscopy techniques — photoactivated localization microscopy (PALM), fluorescence PALM (FPALM) and stochastic optical reconstruction microscopy (STORM) — are based on stochastic detection of single particles (red stars) and their subsequent bleaching and localization (white circles). Localized molecules are summed over time to reveal sub-diffraction-sized features. b | Structured illumination microscopy (SIM) uses a sequence of illumination patterns to decode cellular features (blue line) with different components of spatial orientation. Summing all of the resolved spatial components results in a super-resolved image of the cellular feature (solid grey line). c | Stimulated emission depletion (STED) microscopy uses two concentric focused illumination beams (yellow and orange cones) to reduce the effective volume of detection. The illumination beams are scanned across the cell to resolve small cellular features. d | Transmission electron microscopy (TEM) uses a beam of high-voltage electrons to image features within thin layers or membrane sheets of cells.

References

    1. Huse M. The T-cell-receptor signaling network. J. Cell Sci. 2009;122:1269–1273. - PubMed
    1. Lin J, Weiss A. T cell receptor signalling. J. Cell Sci. 2001;114:243–244. - PubMed
    1. Samelson LE. Signal transduction mediated by the T cell antigen receptor: the role of adapter proteins. Annu. Rev. Immunol. 2002;20:371–394. - PubMed
    1. Schwartzberg PL. Genetic approaches to tyrosine kinase signaling pathways in the immune system. Immunol. Res. 2003;27:481–488. - PubMed
    1. Kaufmann SH. Immunology’s foundation: the 100-year anniversary of the Nobel Prize to Paul Ehrlich and Elie Metchnikoff. Nature Immunol. 2008;9:705–712. - PubMed

Publication types

MeSH terms