. 2010 Dec 10;5(12):e15165.
doi: 10.1371/journal.pone.0015165.

The PluriNetWork: an electronic representation of the network underlying pluripotency in mouse, and its applications

Affiliations

The PluriNetWork: an electronic representation of the network underlying pluripotency in mouse, and its applications

Anup Som et al. PLoS One. .

Abstract

Background: Analysis of the mechanisms underlying pluripotency and reprogramming would benefit substantially from easy access to an electronic network of genes, proteins and mechanisms. Moreover, interpreting gene expression data needs to move beyond just the identification of the up-/downregulation of key genes and of overrepresented processes and pathways, towards clarifying the essential effects of the experiment in molecular terms.

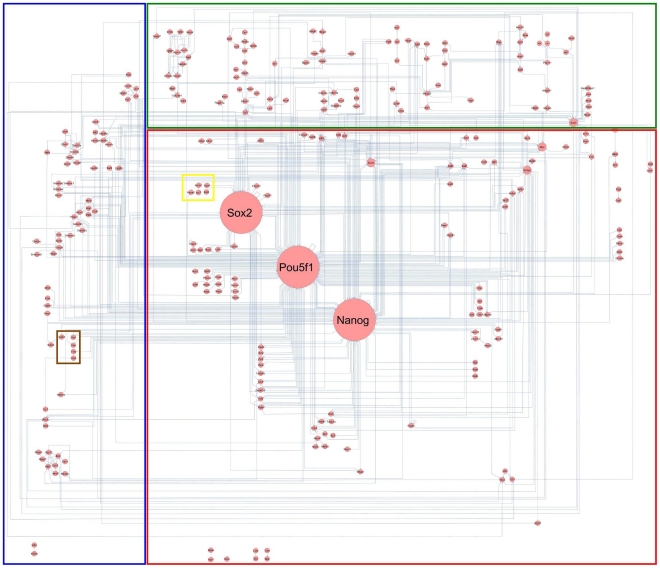
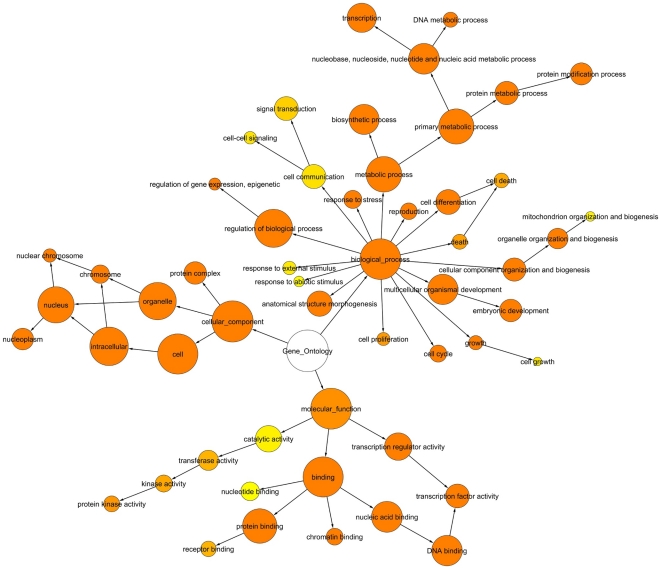
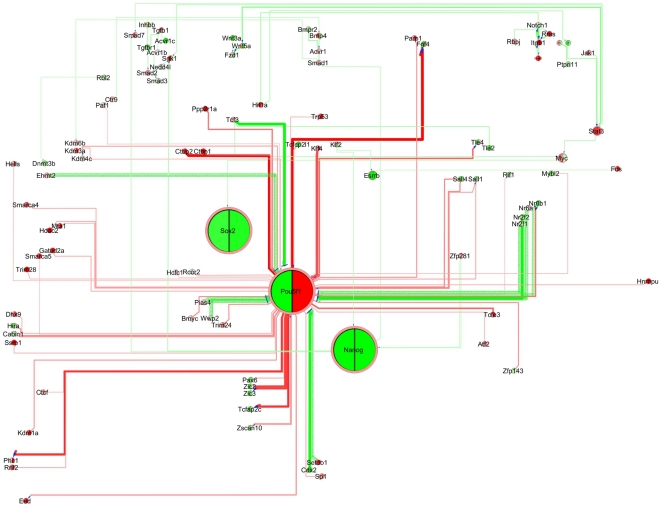
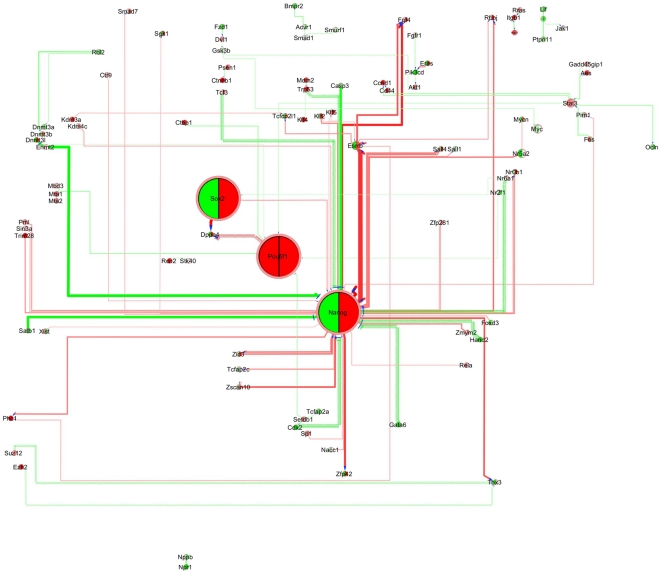
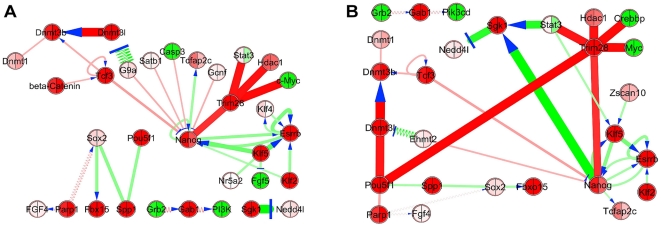
Methodology/principal findings: We have assembled a network of 574 molecular interactions, stimulations and inhibitions, based on a collection of research data from 177 publications until June 2010, involving 274 mouse genes/proteins, all in a standard electronic format, enabling analyses by readily available software such as Cytoscape and its plugins. The network includes the core circuit of Oct4 (Pou5f1), Sox2 and Nanog, its periphery (such as Stat3, Klf4, Esrrb, and c-Myc), connections to upstream signaling pathways (such as Activin, WNT, FGF, BMP, Insulin, Notch and LIF), and epigenetic regulators as well as some other relevant genes/proteins, such as proteins involved in nuclear import/export. We describe the general properties of the network, as well as a Gene Ontology analysis of the genes included. We use several expression data sets to condense the network to a set of network links that are affected in the course of an experiment, yielding hypotheses about the underlying mechanisms.

Conclusions/significance: We have initiated an electronic data repository that will be useful to understand pluripotency and to facilitate the interpretation of high-throughput data. To keep up with the growth of knowledge on the fundamental processes of pluripotency and reprogramming, we suggest to combine Wiki and social networking software towards a community curation system that is easy to use and flexible, and tailored to provide a benefit for the scientist, and to improve communication and exchange of research results. A PluriNetWork tutorial is available at http://www.ibima.med.uni-rostock.de/IBIMA/PluriNetWork/.


Conflict of interest statement

Competing Interests: The authors have declared that no competing interests exist.

Figures

Figure 1
Figure 1. Manual layout of the PluriNetWork in Cytoscape.
Nodes are genes/proteins, edges are stimulations (arrows), inhibitions (T-bar arrows) and interactions (lines). The top third of the network includes upstream signaling pathways, the middle is composed of the core circuitry of pluripotency (Pou5f1 (also known as Oct4), Sox2 and Nanog) and its periphery, and the left part includes epigenetic factors and related mechanisms. At the bottom, we positioned a few small subnetworks such as the interaction of Atrx with Histone H3.3 based on , which are not (yet) connected to the rest of the PluriNetWork.
Figure 2
Figure 2. Graphical symbols of the various link types.
Figure 3
Figure 3. Enrichment analysis of the PluriNetWork genes at a significance level p  = 0.05, using GO terms from GO Slim.
The BiNGO graph visualizes the GO categories that were found significantly over-represented in the context of the GO hierarchy. According to BINGO documentation, the size (area) of the nodes is proportional to the number of genes in our gene set which are annotated to that node. The color of the node represents the (corrected) p-value. White nodes are not significantly over-represented, the other ones are (hypergeometric test, Benjamini & Hochberg False Discovery Rate (FDR) correction), with a color scale ranging from yellow (p-value  =  significance level, here 0.05) to dark orange (p-value  = 5 orders of magnitude smaller than significance level, here 0.0000005). The color saturates at dark orange for p-values which are more than 5 orders of magnitude smaller than the chosen significance level.
Figure 4
Figure 4. PluriNetWork with gene expression data, contrasting the ES cell state and day 2 of an Oct4 conditional knockout.
Gene expression upregulation is denoted in red and downregulation in green. Large differences in expression yield high color intensities.
Figure 5
Figure 5. PluriNetWork condensed by ExprEssence, comparing microarray data from mouse embryonic fibroblast (MEF) and partially induced pluripotent cells (piPS).
The top 10% startups (red) and the top 10% shutdowns (green) are highlighted. Link scores are based on log-transformed gene expression intensities, corrected for variance.
Figure 6
Figure 6. PluriNetWork condensed by ExprEssence, comparing microarray data from mouse partially induced pluripotent cells (piPS) and induced pluripotent cells (iPS).
See also Figure 5.
Figure 7
Figure 7. PluriNetWork condensed by ExprEssence.
March 2010 version (A) and July 2010 version (B), comparing microarray data from two murine ES cell experiments: (1) “12h PD LIF” and (2) “12h PD Jaki” (see Table 3). The top 5% startups (red) and the top 5% shutdowns (green) are highlighted. Link scores are based on the original gene expression intensities. Panel A on the left is adapted from Warsow et al. . The layout is done manually; the ‘circuit layout’ of the PluriNetWork for a condensed network including only 10% of the links would be dominated by white-space, even more than in Figure 5, which features 20% of the links.
Figure 8
Figure 8. FGF stimulation and JAK inhibition promote ES-Epiblast transition.
ES cells were treated for two days with activators and inhibitors of the FGF and JAK pathways, as indicated, and then subjected to quantitative real-time RT-PCR. Egr1 and Socs3 are known downstream targets of these pathways, respectively. Hence, their expression correlates well with the activation status of the two pathways, depending on the corresponding treatment conditions. Klf2 appears to be a repressed target of FGF/ERK signaling, whereas Klf4 is downstream of LIF/STAT3. Note the cooperation of FGF/ERK activation and LIF/STAT3 repression by Jaki in diminishing ES cell-specific Esrrb and in activating epiblast-specific FGF5 (data are in logarithmic scale). Notably, Oct4 levels were preserved, in line with the fact that it is expressed both in ES and epiblast stem cells.

References

    1. Jaenisch R, Young R. Stem cells, the molecular circuitry of pluripotency and nuclear reprogramming. Cell. 2008;132:567–582. - PMC - PubMed
    1. Do JT, Scholer HR. Regulatory circuits underlying pluripotency and reprogramming. Trends Pharmacol Sci. 2009;30:296–302. - PubMed
    1. Pico AR, Kelder T, van Iersel MP, Hanspers K, Conklin BR, et al. WikiPathways: pathway editing for the people. PLoS Biol. 2008;6:e184. - PMC - PubMed
    1. Xu H, Schaniel C, Lemischka IR, Ma'ayan A. Wiley Interdisciplinary Reviews: Systems Biology and Medicine; 2010. Toward a complete in silico, multi-layered embryonic stem cell regulatory network. - PMC - PubMed
    1. MacArthur BD, Ma'ayan A, Lemischka IR. Systems biology of stem cell fate and cellular reprogramming. Nat Rev Mol Cell Biol. 2009;10:672–681. - PMC - PubMed

Publication types