. 2010 Dec 14;5(12):e15194.
doi: 10.1371/journal.pone.0015194.

Photodynamic therapy of tumors can lead to development of systemic antigen-specific immune response

Affiliations

Photodynamic therapy of tumors can lead to development of systemic antigen-specific immune response

Pawel Mroz et al. PLoS One. .

Abstract

Background: The mechanism by which the immune system can effectively recognize and destroy tumors is dependent on recognition of tumor antigens. The molecular identity of a number of these antigens has recently been identified and several immunotherapies have explored them as targets. Photodynamic therapy (PDT) is an anti-cancer modality that uses a non-toxic photosensitizer and visible light to produce cytotoxic reactive oxygen species that destroy tumors. PDT has been shown to lead to local destruction of tumors as well as to induction of anti-tumor immune response.

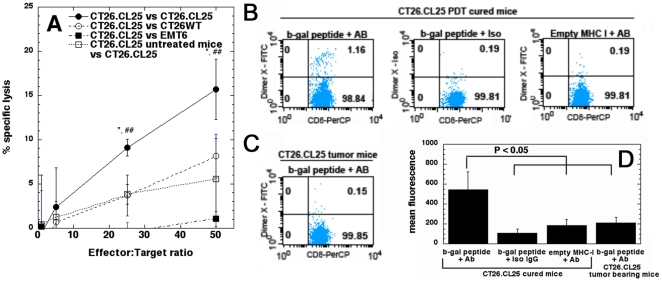
Methodology/principal findings: We used a pair of equally lethal BALB/c colon adenocarcinomas, CT26 wild-type (CT26WT) and CT26.CL25 that expressed a tumor antigen, β-galactosidase (β-gal), and we treated them with vascular PDT. All mice bearing antigen-positive, but not antigen-negative tumors were cured and resistant to rechallenge. T lymphocytes isolated from cured mice were able to specifically lyse antigen positive cells and recognize the epitope derived from beta-galactosidase antigen. PDT was capable of destroying distant, untreated, established, antigen-expressing tumors in 70% of the mice. The remaining 30% escaped destruction due to loss of expression of tumor antigen. The PDT anti-tumor effects were completely abrogated in the absence of the adaptive immune response.

Conclusion: Understanding the role of antigen-expression in PDT immune response may allow application of PDT in metastatic as well as localized disease. To the best of our knowledge, this is the first time that PDT has been shown to lead to systemic, antigen- specific anti-tumor immunity.


Conflict of interest statement

Competing Interests: Pawel Mroz was partly supported by a Genzyme-Partners Translational Research Grant. This a peer-reviewed competitive grant open to Partners investigators and funded by Genzyme. The project that was funded was nothing to do with the present paper (it was to do with kidney cancer and anti-TGF-beta antibody) but it did support Mroz salary. We confirm that this did not alter our adherence to all the PLoS ONE policies on sharing data and materials, as detailed online in our guide for authors.

Figures

Figure 1
Figure 1. In vitro studies.
A. In vitro PDT effectiveness against CT26WT and CT26.CL25 cells. The bars represent standard deviation. B. Histogram analysis of the levels of MHC I molecules in CT26.CL25 and CT26WT cell lines. (Blue) CT26.CL25 unstained control, (Dark Green) CT26.CL25 Isotype control, (Purple) CT26.CL25 anti-MCH I, (Black) CT26WT unstained control, (Bright Green) CT26WT Isotype control, (Red) CT26WT anti MHC I. C. Expression levels of β-gal antigen in CT26WT. D. Expression levels of β-gal antigen in CT26.CL25. E. Scheme of in vivo PDT.
Figure 2
Figure 2. In vivo PDT of tumors (1 leg model).
A. Plots of mean tumor volumes in mice bearing CT26WT tumors and B. CT26.CL25 tumors. Points are means of from 10–15 tumors and bars are SD. C. Kaplan-Meier survival curves of the % of mice cured from CT26.CL25 tumors and rechallenged either with CT26.CL25 cells or CT26WT cells. Naïve mice are included as a control for tumorigenic properties of the cells. Survival curve for rechallenge with CT26.CL25 cells is significantly different from the other two curves (P<0.0001). D. Mean levels of cytokines (TNF-alpha, IFN-gamma, IL-2 and IL-4) measured in the CT26WT and CT26.CL25 tumors 5 days after PDT as well as in control, non treated tumors. *** p<0.001. The bars represent standard deviation.
Figure 3
Figure 3. Analysis of antigen and epitope specificity of observed PDT induced immune response.
A. Percentage of specific lysis of target cells (CT26.CL25, CT26WT or EMT6 as an irrelevant target control) by CTLs isolated from either CT26.CL25 PDT cured or control CT26.CL25 tumor bearing mice (3–4 mice per group). Data are representative of 3 independent experiments. * P<0.05 compared to CT26.CL25 cured CTLs against CT26WT targets, and compared to CTLs from CT26.CL25 tumor bearing mice. ## P<0.001 compared to CT26.CL25 cured CTLs against EMT6 targets. The bars represent standard deviation. B. Lymph node cells isolated from PDT treated mice curedfrom antigen positive CT26.CL25 tumors 5 days after rechallenge incubated with DimerX loaded with TPHPARIGL peptide derived from β-gal antigen or empty DimerX, and either FITC-detection antibody or FITC isotype control. Additionally cells were stained for CD8 expression to assess percentage of CD8-DimerX-FITC double positive cells. C. Lymph node cells from CT26.CL25 control tumor bearing mice incubated with DimerX loaded with TPHPARIGL peptide derived from β-gal antigen and FITC-detection antibody. Additionally cells were stained for CD8 expression to assess percentage of CD8-DimerX-FITC double positive cells. D. Quantification and statistical analysis of the FACS plots described above (6 mice per group). The bars represent standard deviation.
Figure 4
Figure 4. In vivo PDT of tumors (2 leg model).
Time courses of individual tumor volumes in mice with two similar bilateral or mismatched tumors in right and left legs. A. Bilateral CT26WT tumors, right leg treated with PDT (n = 10); B. Bilateral CT26WT tumors, untreated (n = 5); C. Bilateral CT26.CL25 tumors, right leg treated with PDT (n = 10); D. Bilateral CT26.CL25 tumors, untreated (n = 5). E. Kaplan-Meier survival curves of the % of mice with tumors less than 1-cm diameter in five groups of mice. Three groups had two similar bilateral CT26.CL25 tumors (one group was untreated, one group had right leg tumor treated with PDT and one group had right leg tumor surgically removed). Two further groups had two bilateral CT26WT tumors (one group was untreated, and the other group had the right leg tumor treated with PDT). The survival curve of the mice with bilateral CT26.CL25 tumors treated with PDT is significantly different from the other survival curves (P<0.0001). F. Mismatched tumors. CT26WT and CT26.CL25 tumors, CT26WT treated with PDT (n = 5). G. Mismatched tumors. CT26WT and CT26.CL25 tumors, CT26.CL25 treated with PDT (n = 5).
Figure 5
Figure 5. Immunohistochemical staining for LAMP-1 (CD107a) of CT26.CL25 tumors.
A. non-treated control. B. negative control for staining. C. CT26.CL25 PDT treated tumors day 5. D. CT26.CL25 non-treated, contralateral tumors day 5. E. CT26.CL25 PDT treated tumors day 16. F. CT26.CL25 non-treated, contralateral tumors day 16. Analysis of β-gal antigen expression and loss by X-gal staining. G. CT26WT control tumors negative for β-gal antigen, H. CT26.CL25 non-treated control tumors which show robust blue positive staining for β-gal antigen. I. CT26.CL25 non-treated, contralateral tumors that escaped immune surveillance and continued to grow. They show significantly decreased staining for β-gal antigen.
Figure 6
Figure 6. Lack of adaptive immune response abrogates PDT anti-tumor effects.
A. Tumor volumes of CT26.CL25 tumors subjected or not to PDT in BALB/c Nu/Nu immunocompromised mice. The bars represent standard deviation. B. Tumor volumes of bilateral CT26.CL25 tumors subjected or not to PDT in BALB/c Nu/Nu immunocompromised mice. The bars represent standard deviation. C. Kaplan-Meier analysis comparing the % of surviving BALB/c and BALB/c Nu/Nu mice bearing CT26.CL25 of CT26WT tumors subjected to PDT. Non-treated BALB/c Nu/Nu mice bearing CT26.CL25 are included for control (n = 5).

References

    1. van der Bruggen P, Van den Eynde BJ. Processing and presentation of tumor antigens and vaccination strategies. Curr Opin Immunol. 2006;18:98–104. - PubMed
    1. Van den Eynde BJ, van der Bruggen P. T cell defined tumor antigens. Curr Opin Immunol. 1997;9:684–693. - PubMed
    1. Hirohashi Y, Torigoe T, Inoda S, Kobayasi J, Nakatsugawa M, et al. The functioning antigens: beyond just as the immunological targets. Cancer Sci. 2009;100:798–806. - PMC - PubMed
    1. Van den Eynde B, Lethe B, Van Pel A, De Plaen E, Boon T. The gene coding for a major tumor rejection antigen of tumor P815 is identical to the normal gene of syngeneic DBA/2 mice. J Exp Med. 1991;173:1373–1384. - PMC - PubMed
    1. Van den Eynde B, Peeters O, De Backer O, Gaugler B, Lucas S, et al. A new family of genes coding for an antigen recognized by autologous cytolytic T lymphocytes on a human melanoma. J Exp Med. 1995;182:689–698. - PMC - PubMed

Publication types