. 2010 Dec 13:4:222.
doi: 10.3389/fnhum.2010.00222. eCollection 2010.

To head or to heed? Beyond the surface of selective action inhibition: a review

Affiliations

To head or to heed? Beyond the surface of selective action inhibition: a review

Wery P M van den Wildenberg et al. Front Hum Neurosci. .

Abstract

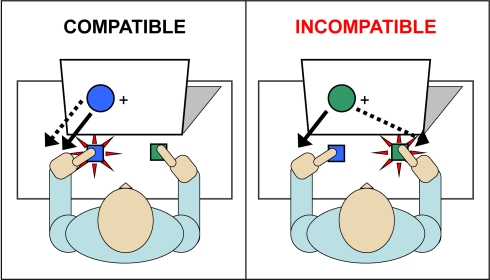
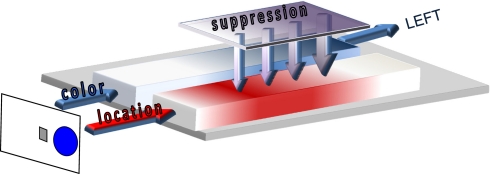
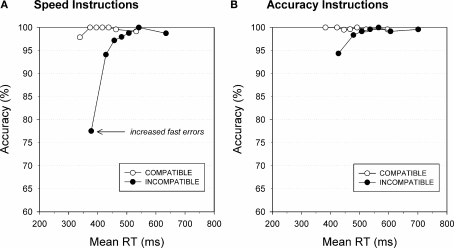
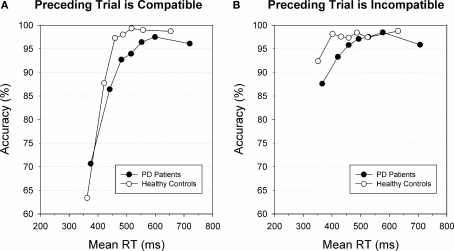
To head rather than heed to temptations is easier said than done. Since tempting actions are often contextually inappropriate, selective suppression is invoked to inhibit such actions. Thus far, laboratory tasks have not been very successful in highlighting these processes. We suggest that this is for three reasons. First, it is important to dissociate between an early susceptibility to making stimulus-driven impulsive but erroneous actions, and the subsequent selective suppression of these impulses that facilitates the selection of the correct action. Second, studies have focused on mean or median reaction times (RT), which conceals the temporal dynamics of action control. Third, studies have focused on group means, while considering individual differences as a source of error variance. Here, we present an overview of recent behavioral and imaging studies that overcame these limitations by analyzing RT distributions. As will become clear, this approach has revealed variations in inhibitory control over impulsive actions as a function of task instructions, conflict probability, and between-trial adjustments (following conflict or following an error trial) that are hidden if mean RTs are analyzed. Next, we discuss a selection of behavioral as well as imaging studies to illustrate that individual differences are meaningful and help understand selective suppression during action selection within samples of young and healthy individuals, but also within clinical samples of patients diagnosed with attention deficit/hyperactivity disorder or Parkinson's disease.

Keywords: action control; basal ganglia; interference control; prefrontal cortex; response inhibition.


Figures

Figure 1
Figure 1
Simon task. Participants press the left button to a blue circle and a right button to a green circle (dashed line). Responses are also driven by an irrelevant stimulus dimension, circle location, as indicated by the solid line. For compatible trials, both relevant (color) and irrelevant (location) stimulus dimensions activate the correct action. On incompatible trials, the irrelevant dimension activates an incorrect response tendency, which interferes with selection of the correct response.
Figure 2
Figure 2
Activation–suppression model. The relevant stimulus dimension (color blue) is processed by the slow deliberate route (represented in blue) while the irrelevant location dimension (right location activating the right hand) is processed by the fast direct route (in red). Selective suppression of the location-based activation by the inhibition module (represented in purple) needs time to build up, and facilitates the selection and execution of the correct left-hand response.
Figure 3
Figure 3
Task instructions affect fast errors. Conditional accuracy functions illustrate the increased tendency to commit fast errors to incompatible flanker (black circles) compared to compatible flanker trials (white circles). The proportion of fast errors on conflict trials increases under instructions that emphasize speed (A) compared to accuracy of responding (B). Figure modified after Wylie et al. (2009b).
Figure 4
Figure 4
Effect of preceding trial on fast errors. Conditional accuracy functions for incompatible trials preceded by compatible trials (A) or by incompatible trials (B) for individuals diagnosed with Parkinson's disease (black circles) and healthy controls (white circles). For both groups, fast responses on incompatible trials are associated with increased error rates, notably on trials that follow compatible trials. Both groups displayed these between-trial adjustments. Figure modified after Wylie et al. (2010).
Figure 5
Figure 5
Delta plot for RT. (A) Delta plot illustrating impaired selective suppression in patients diagnosed with Parkinson's disease (black) compared to age-matched healthy controls (white). (B) Delta plot illustrating impaired selective suppression in mild to moderate PD patients associated with relatively more severe clinical symptoms compared to patients with less severe symptoms. Figure modified after Wylie et al. (2010).
Figure 6
Figure 6
Partial EMG errors. (A) Electromyogram (EMG) from muscles controlling the incorrect (upper trace) and the correct response (lower trace). The vertical dashed line indicates the mechanical button-press response. The correct overt response was preceded by partial EMG activity in the muscle that controls the incorrect response that is too weak to trigger an overt error. (B) Fast responses on incompatible trials yield a high percentage of stimulus-driven partial EMG errors of the incorrect hand before the correct button press is emitted. Re-analyzed data published by Burle et al. (2002).
Figure 7
Figure 7
RT delta plots including and excluding partial error trials. RT delta plots for trials with a correct button-press response. Including trials with partial EMG errors yields a steeper negative slope value (black circles) compared to excluding EMG error trials (white circles). Re-analyzed data published by Burle et al. (2002).
Figure 8
Figure 8
Slope values predict brain activation. Covariate analyses with individual behavioral parameters from 24 participants. Top row displays the average conditional accuracy function (CAF) and average delta slopes separated in fast, middle, and slow RT segments. Middle row left shows Pearson correlations between the first CAF slope for incompatible trials and the % signal change (x-axis) derived from the pre-SMA. Middle row right shows Pearson correlations between the last delta slope (y-axis) and % signal change (x-axis) derived from the right IFC. Figure modified after Forstmann et al. (2008b).
Figure 9
Figure 9
Relation between delta slope, rIFC activation, and structural measures. (A) Axial view showing the inferior fronto-occipital fasciculus (FOF, in green). Contrasting good versus poor inhibitors shows increased connectivity in the anterior FOF (in red) and increased BOLD activation in the right IFC (blue). (B, upper plot) Pearson correlation between connectivity in the anterior part of the FOF and slope values derived from the delta plot of the last RT segment. (B, lower plot) Pearson correlation between connectivity in the anterior part of the FOF and percentage BOLD signal change derived from the right IFC. Figure modified after Forstmann et al. (2008a).

References

    1. Allain S., Burle B., Hasbroucq T., Vidal F. (2009). Sequential adjustments before and after partial errors. Psychon. Bull. Rev. 16, 356–36210.3758/PBR.16.2.356 - DOI - PubMed
    1. Allain S., Carbonnell L., Burle B., Hasbroucq T., Vidal F. (2004). “Electromyographic activities and the Ne,” in Errors, Conflicts, and the Brain: Current Opinions on Performance Monitoring, eds Ullsperger M., Falkenstein M. (Leipzig: MPI of Cognitive Neuroscience; ), 21–27
    1. Aron A. R., Behrens T. E., Smith S., Frank M. J., Poldrack R. A. (2007). Triangulating a cognitive control network using diffusion-weighted magnetic resonance imaging (MRI) and functional MRI. J. Neurosci. 27, 3743–375210.1523/JNEUROSCI.0519-07.2007 - DOI - PMC - PubMed
    1. Ballanger B., van Eimeren T., Moro E., Lozano A. M., Hamani C., Boulinguez P., Pellecchia G., Houle S., Poon Y. Y., Lang A. E., Strafella A. P. (2009). Stimulation of the subthalamic nucleus and impulsivity: release your horses. Ann. Neurol. 66, 817–82410.1002/ana.21795 - DOI - PMC - PubMed
    1. Band G. P. H., Ridderinkhof K. R., van der Molen M. W. (2003). Speed-accuracy modulation in case of conflict: the roles of activation and inhibition. Psychol. Res. 67, 266–27910.1007/s00426-002-0127-0 - DOI - PubMed