Comparative Study
. 2010;11(12):R124.
doi: 10.1186/gb-2010-11-12-r124. Epub 2010 Dec 23.

Large scale comparison of global gene expression patterns in human and mouse

Affiliations
Comparative Study

Large scale comparison of global gene expression patterns in human and mouse

Xiangqun Zheng-Bradley et al. Genome Biol. 2010.

Abstract

Background: It is widely accepted that orthologous genes between species are conserved at the sequence level and perform similar functions in different organisms. However, the level of conservation of gene expression patterns of the orthologous genes in different species has been unclear. To address the issue, we compared gene expression of orthologous genes based on 2,557 human and 1,267 mouse samples with high quality gene expression data, selected from experiments stored in the public microarray repository ArrayExpress.

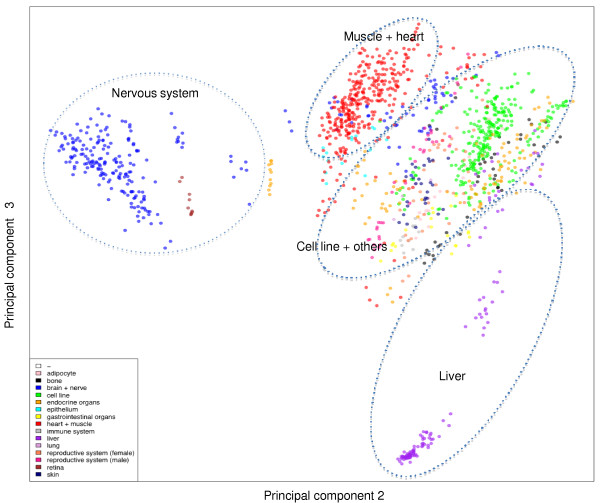
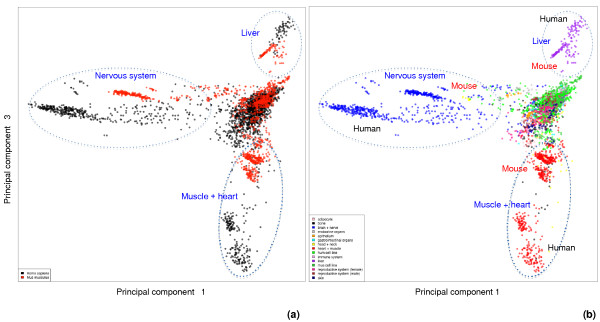
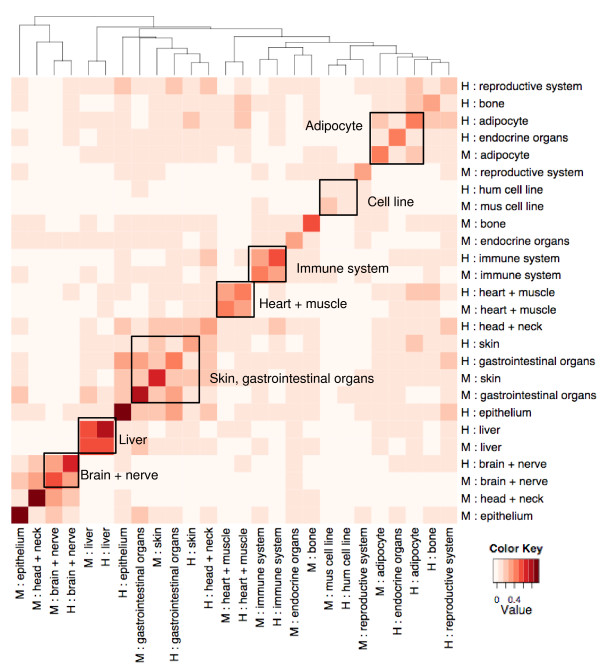
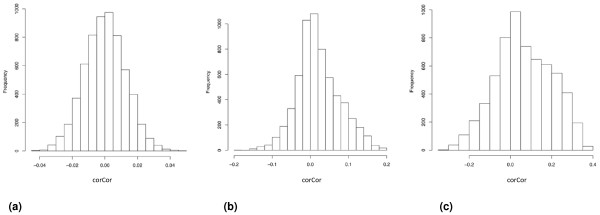
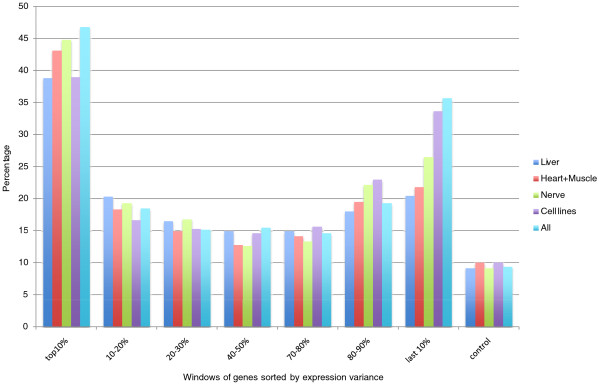
Results: In a principal component analysis (PCA) of combined data from human and mouse samples merged on orthologous probesets, samples largely form distinctive clusters based on their tissue sources when projected onto the top principal components. The most prominent groups are the nervous system, muscle/heart tissues, liver and cell lines. Despite the great differences in sample characteristics and experiment conditions, the overall patterns of these prominent clusters are strikingly similar for human and mouse. We further analyzed data for each tissue separately and found that the most variable genes in each tissue are highly enriched with human-mouse tissue-specific orthologs and the least variable genes in each tissue are enriched with human-mouse housekeeping orthologs.

Conclusions: The results indicate that the global patterns of tissue-specific expression of orthologous genes are conserved in human and mouse. The expression of groups of orthologous genes co-varies in the two species, both for the most variable genes and the most ubiquitously expressed genes.


Figures

Figure 1
Figure 1
PCA plot of the integrated mouse gene expression data matrix. Each dot represents a sample, which is colored by the annotation of its tissue type. The samples can be loosely divided in four areas from left to right: nervous system (blue), muscle/heart (red), cell line (green) and others, and liver (purple). The brown dots co-clustering with nervous system samples are retina samples. Samples with unknown organism part (-) are white so they are invisible.
Figure 2
Figure 2
PCA plots of a combined human and mouse gene expression data matrix (principal components 1 and 3). Each dot represents a sample, which is labeled by (a) species and (b) tissue type. Cell line samples from both species form a big central cluster, together with a relative small number of samples from immune system, reproductive system, bone, endocrine organs and other tissue sources from both species. Away from this central cluster, three major sample clusters are indicated: muscle/heart samples (red), nervous system samples (blue) and liver samples (purple). For these three clusters, human and mouse samples exhibit subclustering in proximity to each other. In the nervous system cluster, a few mouse head and neck samples (yellow) are mixed in - these are retina samples that have been generalized into the head and neck category. In the muscle/heart cluster, a few human bone samples (black) and a few head and neck samples (yellow) are mixed in.
Figure 3
Figure 3
Hierarchical clustering heatmap of Pearson correlation coefficients between major tissue types of human and mouse. The outlined boxes indicate tissues in which human and mouse data clustered together.
Figure 4
Figure 4
Distribution of corCor between human and mouse ortholog genes. X-axis is corCor value; Y-axis is number of orthologs. (a) Randomized negative control. (b) corCor between human genes and their mouse orthologs in all samples. (c) Positive control with corCor between human genes measured in nervous system and human genes measured in muscle/heart. Please note that the values on the X-axis in (b,c) are a magnitude higher than those in (a).
Figure 5
Figure 5
Percentage of shared mouse and human orthologs in windows of 600 genes sorted by expression variance (descending from left to right).

Comment in

References

    1. Yanai I, Graur D, Ophir R. Incongruent expression profiles between human and mouse orthologous genes suggest widespread neutral evolution of transcription control. Omics. 2004;8:15–24. doi: 10.1089/153623104773547462. - DOI - PubMed
    1. Jordan IK, Marino-Ramirez L, Koonin EV. Evolutionary significance of gene expression divergence. Gene. 2005;345:119–126. doi: 10.1016/j.gene.2004.11.034. - DOI - PMC - PubMed
    1. Han ES, Hickey M. Microarray evaluation of dietary restriction. J Nutr. 2005;135:1343–1346. - PubMed
    1. Su AI, Wiltshire T, Batalov S, Lapp H, Ching KA, Block D, Zhang J, Soden R, Hayakawa M, Kreiman G, Cooke MP, Walker JR, Hogenesch JB. A gene atlas of the mouse and human protein-encoding transcriptomes. Proc Natl Acad Sci USA. 2004;101:6062–6067. doi: 10.1073/pnas.0400782101. - DOI - PMC - PubMed
    1. Rustici G, Mata J, Kivinen K, Lio P, Penkett CJ, Burns G, Hayles J, Brazma A, Nurse P, Bahler J. Periodic gene expression program of the fission yeast cell cycle. Nat Genet. 2004;36:809–817. doi: 10.1038/ng1377. - DOI - PubMed

Publication types

LinkOut - more resources