

DTI measures in crossing-fibre areas: increased diffusion anisotropy reveals early white matter alteration in MCI and mild Alzheimer's disease
- PMID: 21182970
- PMCID: PMC7116583
- DOI: 10.1016/j.neuroimage.2010.12.008
DTI measures in crossing-fibre areas: increased diffusion anisotropy reveals early white matter alteration in MCI and mild Alzheimer's disease
Abstract
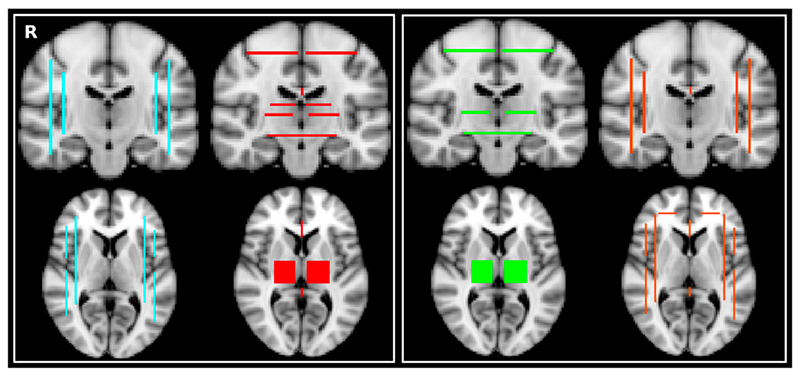
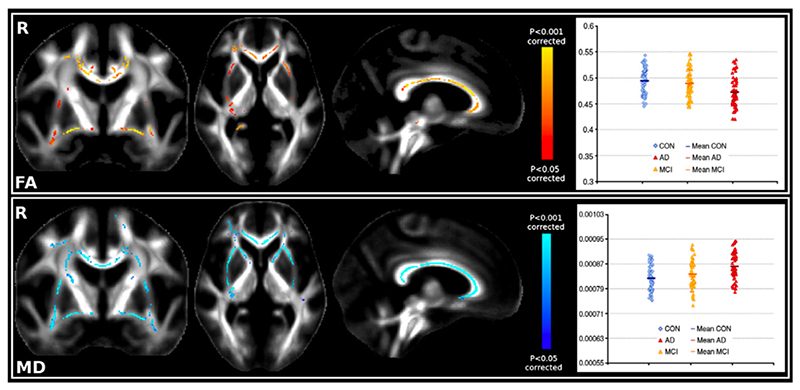
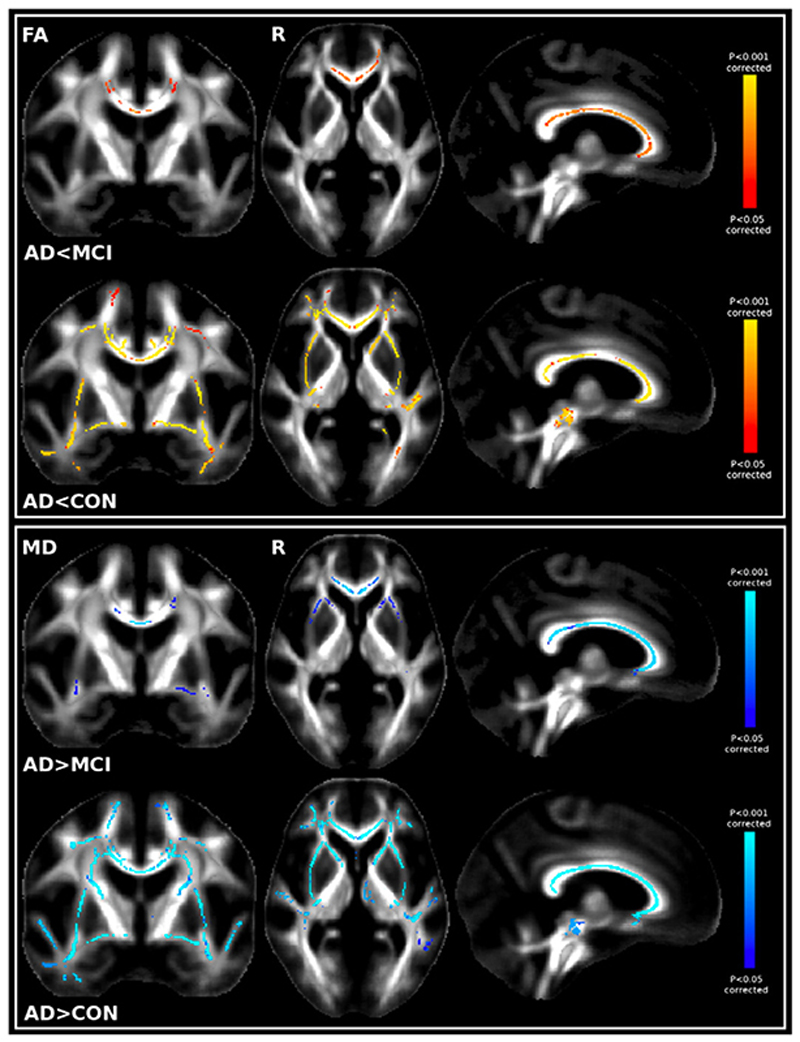
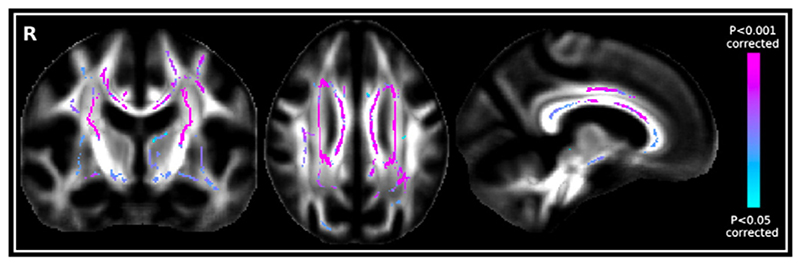
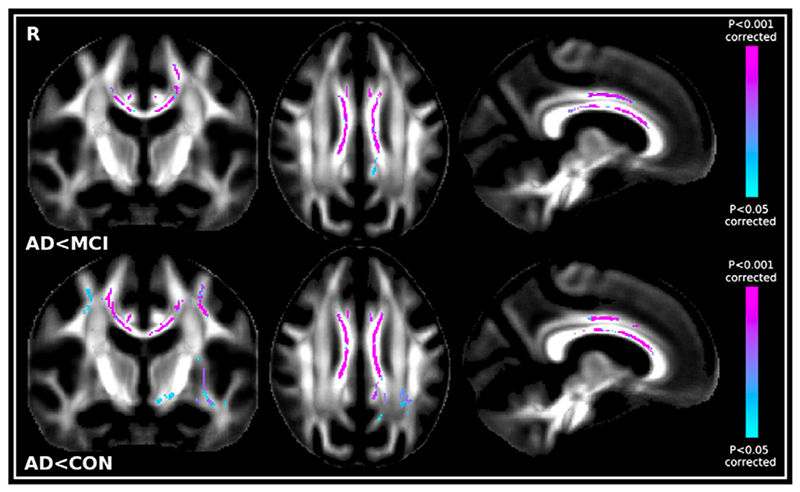
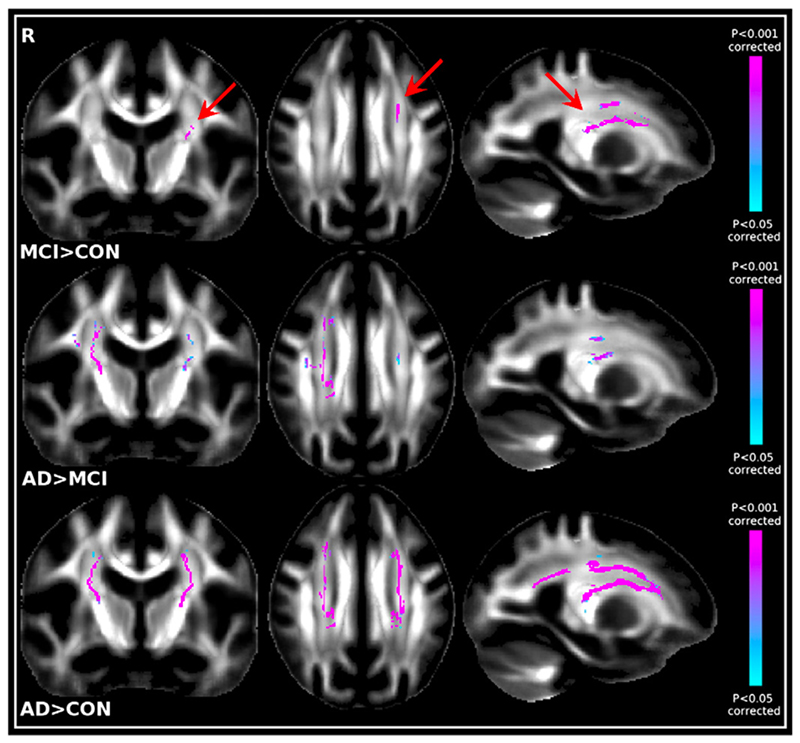
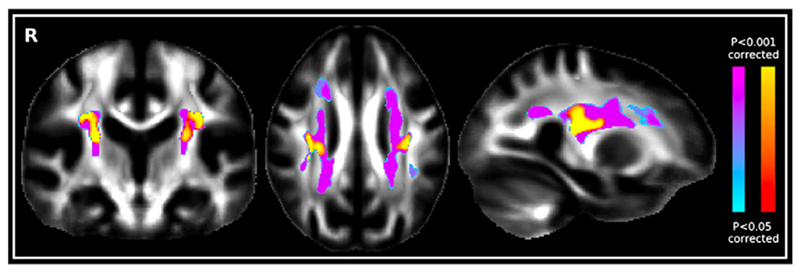
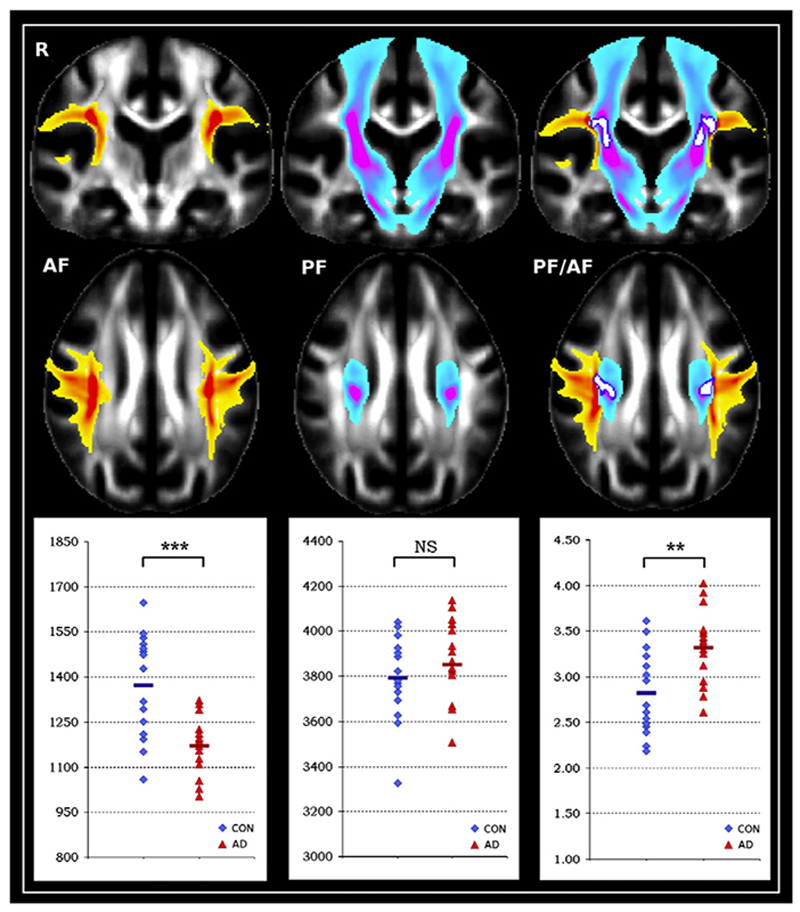
Though mild cognitive impairment is an intermediate clinical state between healthy aging and Alzheimer's disease (AD), there are very few whole-brain voxel-wise diffusion MRI studies directly comparing changes in healthy control, mild cognitive impairment (MCI) and AD subjects. Here we report whole-brain findings from a comprehensive study of diffusion tensor indices and probabilistic tractography obtained in a very large population of healthy controls, MCI and probable AD subjects. As expected from the literature, all diffusion indices converged to show that the cingulum bundle, the uncinate fasciculus, the entire corpus callosum and the superior longitudinal fasciculus are the most affected white matter tracts in AD. Significant differences between MCI and AD were essentially confined to the corpus callosum. More importantly, we introduce for the first time in a degenerative disorder an application of a recently developed tensor index, the "mode" of anisotropy, as well as probabilistic crossing-fibre tractography. The mode of anisotropy specifies the type of anisotropy as a continuous measure reflecting differences in shape of the diffusion tensor ranging from planar (e.g., in regions of crossing fibres from two fibre populations of similar density or regions of "kissing" fibres) to linear (e.g., in regions where one fibre population orientation predominates), while probabilistic crossing-fibre tractography allows to accurately trace pathways from a crossing-fibre region. Remarkably, when looking for whole-brain diffusion differences between MCI patients and healthy subjects, the only region with significant abnormalities was a region of crossing fibres in the centrum semiovale, showing an increased mode of anisotropy. The only white matter region demonstrating a significant difference in correlations between neuropsychological scores and a diffusion measure (mode of anisotropy) across the three groups was the same region of crossing fibres. Further examination using probabilistic tractography established explicitly and quantitatively that this previously unreported increase of mode and co-localised increase of fractional anisotropy was explained by a relative preservation of motor-related projection fibres (at this early stage of the disease) crossing the association fibres of the superior longitudinal fasciculus. These findings emphasise the benefit of looking at the more complex regions in which spared and affected pathways are crossing to detect very early alterations of the white matter that could not be detected in regions consisting of one fibre population only. Finally, the methods used in this study may have general applicability for other degenerative disorders and, beyond the clinical sphere, they could contribute to a better quantification and understanding of subtle effects generated by normal processes such as visuospatial attention or motor learning.
Copyright © 2010 Elsevier Inc. All rights reserved.
Figures
References
-
- Acosta-Cabronero J, Williams GB, Pengas G, Nestor PJ. Absolute diffusivities define the landscape of white matter degeneration in Alzheimer's disease. Brain. 2010 Feb;133(Pt 2):529–539. - PubMed
-
- American Psychiatric Association. Diagnostic and Statistical Manual of Mental Disorders. 4th edn. American Psychiatric Association; Washington, DC: 1994. p. 390.
-
- Andersson J, Smith S, Jenkinson M. FNIRT — FMRIB's Non-linear Image Registration Tool. Presented at 13th annual meeting of the Organization for Human Brain Mapping (#496); 2008.
-
- Assaf Y. Can we use diffusion MRI as a bio-marker of neurodegenerative processes? Bioessays. 2008 Nov;30(11–12):1235–1245. - PubMed
-
- Beaulieu C. The basis of anisotropic water diffusion in the nervous system — a technical review. NMR Biomed. 2002 Nov-Dec;15(7–8):435–455. - PubMed
Publication types
MeSH terms
Grants and funding
LinkOut - more resources
Full Text Sources
Medical
Research Materials
