. 2010 Dec 23;143(7):1084-96.
doi: 10.1016/j.cell.2010.12.008.

Paternally induced transgenerational environmental reprogramming of metabolic gene expression in mammals

Affiliations

Paternally induced transgenerational environmental reprogramming of metabolic gene expression in mammals

Benjamin R Carone et al. Cell. .

Abstract

Epigenetic information can be inherited through the mammalian germline and represents a plausible transgenerational carrier of environmental information. To test whether transgenerational inheritance of environmental information occurs in mammals, we carried out an expression profiling screen for genes in mice that responded to paternal diet. Offspring of males fed a low-protein diet exhibited elevated hepatic expression of many genes involved in lipid and cholesterol biosynthesis and decreased levels of cholesterol esters, relative to the offspring of males fed a control diet. Epigenomic profiling of offspring livers revealed numerous modest (∼20%) changes in cytosine methylation depending on paternal diet, including reproducible changes in methylation over a likely enhancer for the key lipid regulator Ppara. These results, in conjunction with recent human epidemiological data, indicate that parental diet can affect cholesterol and lipid metabolism in offspring and define a model system to study environmental reprogramming of the heritable epigenome.


Figures

Figure 1
Figure 1. A screen for genes regulated by paternal diet
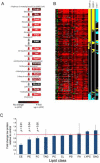
(A) Experimental design. Male mice were fed control or low (11%) protein diet from weaning until sexual maturity, then were mated to females that were raised on control diet. Males were removed after one or two days of mating. Livers were harvested from offspring at three weeks, and RNA was prepared, labeled, and hybridized to oligonucleotide microarrays. (B) Overview of microarray data, comparing offspring of sibling males fed different diets – red boxes indicate higher RNA levels in low protein than control offspring, green indicates higher expression in controls. Boxes at the top indicate comparisons between two male (purple) or two female (yellow) offspring. Each column shows results from a comparison of a pair of offspring. Only genes passing the stringent threshold for significant change (Figure S1B) are shown. Data are clustered by experiment (columns), and by genes (rows). (C) Validation of microarray data. Quantitative RT-PCR was used to determine levels of Squalene epoxidase (Sqle) relative to the control gene Vitronectin (Vtn) which showed no change in the microarray dataset. Animals are grouped by paternal diet and by sex, and data are expressed as ΔCT between Sqle and Vtn, normalized relative to the average of control females. Additional validation is shown in Figure S1A. p values were calculated using t-test. See also Table S1, Figures S1 and S2.
Figure 2
Figure 2. Multiple pathways are affected by paternal diet
Comparison of upregulated gene expression profile with a compendium of public datasets of hepatic gene expression. A clustering of our upregulated genes according to their notation in the 28 significant (p<0.00025) overlapping signatures from an assembled compendium of 120 publicly-available murine liver signatures under various conditions and genetic perturbations (GEO, (Horton et al., 2003; Yang et al., 2009). For each significant profile, the majority of overlapping genes are shown as yellow, while genes with opposite regulation (ie down rather than up in the dataset in question) are blue. The genes divide into two distinct clusters, one enriched in DNA replication and the other in various categories of fat and cholesterol biosynthesis. See also Table S2 and Figure S3.
Figure 3
Figure 3. Altered cholesterol metabolism in the low protein cohort
(A) Cholesterol biosynthesis. Genes annotated as cholesterol biosynthesis genes are shown, with colors indicating average difference in expression in low protein vs. control comparisons. (B) Many genes upregulated in the low protein cohort are SREBP targets. Upregulated cluster from Figure 1B is shown, along with data from (Horton et al., 2003). Genes scored as up in both replicates from Ref. (Horton et al., 2003) are shown as yellow, genes scored as down are blue. Columns show data from transgenic mice overexpressing SREBP-1a or SREBP-2, or from scap−/− knockout mice. (C) Cholesterol levels are decreased in livers of low protein offspring. Data from lipidomic profiling of liver tissue from three control and three low protein animal are shown as mean +/− standard deviation. Red line indicates no change. p values were calculated using a paired t-test on log-transformed lipid abundance data. Cholesterol esters, CE; phosphatidylethanolamine, PE; free cholesterol, FC; triacylglycerol, TAG; phopshatidylcholine, PC; cardiolipin, CL; phosphatidylserine, PS ; free fatty acid, FA; lysophosphatidylcholine, LYPC; and diacylglycerol, DAG. See also Table S3.
Figure 4
Figure 4. Proliferation-related microRNAs respond to paternal diet
Small (<35 nt) RNAs from the livers of eight offspring (four control, four low protein) was isolated and subject to high-throughput sequencing. MicroRNAs that exhibited consistent changes in all four pairs of animals are shown, with average change shown as a bar and individual comparisons shown as points. See also Table S4.
Figure 5
Figure 5. Transgenerational effects of paternal diet on hepatic cytosine methylation
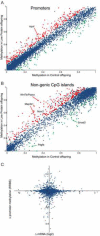
(A) Genomic DNA from control and low protein offspring livers was subjected to reduced-representation bisulfite sequencing. For all annotated promoters, average fraction of CpGs that were methylated is shown for the control sample (x axis) compared to the low protein sample (y axis). Red and green dots indicate promoters with significant (p < 0.05) methylation changes of over 10%. (B) As in (A), for nongenic CpG islands. (C) Promoter cytosine methylation changes are uncorrelated with gene expression changes. For each promoter, the average change in cytosine methylation is compared to the change in mRNA abundance from Figure 1B. See also Table S5 and Figure S4.
Figure 6
Figure 6. Effects of paternal diet on methylation of a putative Ppara enhancer
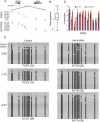
(A) Differential methylation of a putative Ppara enhancer. Top panel shows a schematic of chromosome 15: 85,360,000–85,640,000. Zoomed in region represents chr15: 85,514,715–85,514,920. RRBS data for one control and one low protein offspring pair is shown below, with assayed CpGs represented as boxes colored to indicate % of clones methylated. Numbers to the left indicate % methylation, with number of sequence reads covering the CpG in parentheses. (B) Ppara is downregulated in most low protein offspring livers. Box plot shows mean, quartiles, and highest and lowest values from Table S1. (C) Putative enhancer methylation correlates with Ppara downregulation. DNA from eight control and nine low protein pairs of offspring livers was bisulfite treated, and at least 13 clones were analyzed for each animal. % methylation at each of the 12 CpGs in this region plotted on the y axis, data are shown as mean+/−SEM. (D) Individual bisulfite clones are shown for three control and three low protein offspring. White circles indicate unmethylated CpGs, black circles indicate methylated CpGs. Microarray data for change in Ppara RNA levels between the paired animals is shown to the left, in log2. Values under each bisulfite grouping indicate overall % methylation, with number of clones analyzed in parentheses.
Figure 7
Figure 7. Modest effects of diet on the sperm epigenome
(A) MeDIP-sequencing data is shown for two liver samples (top two tracks), and four sperm samples (bottom four), at a maternally-methylated region (Gnas, left) and a paternally-methylated region (Rasgrf1, right). (B) Comparison of control and low protein methylation. For each promoter, methylation levels were averaged for 8 kb surrounding the TSS, and values are scatterplotted for control sperm (x axis) vs. low protein sperm (y axis). x and y axes are plotted on logarithmic scales (C) As in (B), but for control vs. caloric restriction. (D) As in (B), but for the pair of control samples. Similar results for (B–D) are found when focusing on the 1 kb surrounding the TSS (not shown). See Figure S7 for analyses of consistent RNA and chromatin differences between low protein and control sperm.

Comment in

  • Epigenetics: Dad's diet lives on.
    Flintoft L. Flintoft L. Nat Rev Genet. 2011 Feb;12(2):80. doi: 10.1038/nrg2941. Nat Rev Genet. 2011. PMID: 21245827 No abstract available.
  • You are what your dad ate.
    Ferguson-Smith AC, Patti ME. Ferguson-Smith AC, et al. Cell Metab. 2011 Feb 2;13(2):115-7. doi: 10.1016/j.cmet.2011.01.011. Cell Metab. 2011. PMID: 21284975

References

    1. Anderson LM, Riffle L, Wilson R, Travlos GS, Lubomirski MS, Alvord WG. Preconceptional fasting of fathers alters serum glucose in offspring of mice. Nutrition (Burbank, Los Angeles County, Calif. 2006;22:327–331. - PubMed
    1. Anway MD, Cupp AS, Uzumcu M, Skinner MK. Epigenetic transgenerational actions of endocrine disruptors and male fertility. Science. 2005;308:1466–1469. - PMC - PubMed
    1. Arpanahi A, Brinkworth M, Iles D, Krawetz SA, Paradowska A, Platts AE, Saida M, Steger K, Tedder P, Miller D. Endonuclease-sensitive regions of human spermatozoal chromatin are highly enriched in promoter and CTCF binding sequences. Genome Res. 2009 - PMC - PubMed
    1. Avital E, Jablonka E. Animal traditions : behavioural inheritance in evolution. Cambridge University Press; Cambridge, UK: New York: 2000. - PubMed
    1. Bartolomei MS, Webber AL, Brunkow ME, Tilghman SM. Epigenetic mechanisms underlying the imprinting of the mouse H19 gene. Genes Dev. 1993;7:1663–1673. - PubMed

Publication types

Associated data