. 2011 Jan;121(1):148-60.
doi: 10.1172/JCI42874. Epub 2010 Dec 22.

Arsenic trioxide inhibits human cancer cell growth and tumor development in mice by blocking Hedgehog/GLI pathway

Affiliations

Arsenic trioxide inhibits human cancer cell growth and tumor development in mice by blocking Hedgehog/GLI pathway

Elspeth M Beauchamp et al. J Clin Invest. 2011 Jan.

Abstract

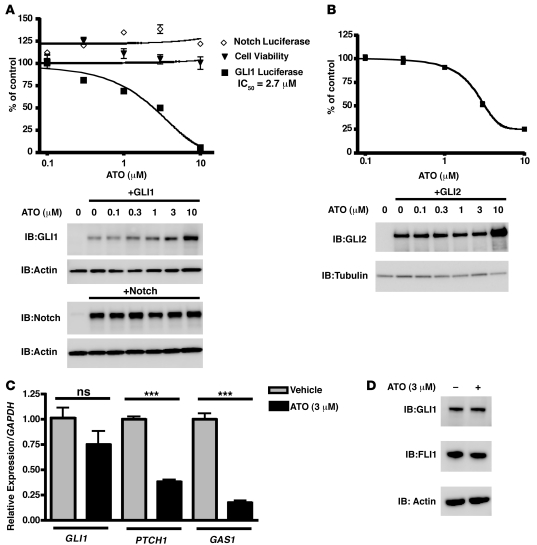
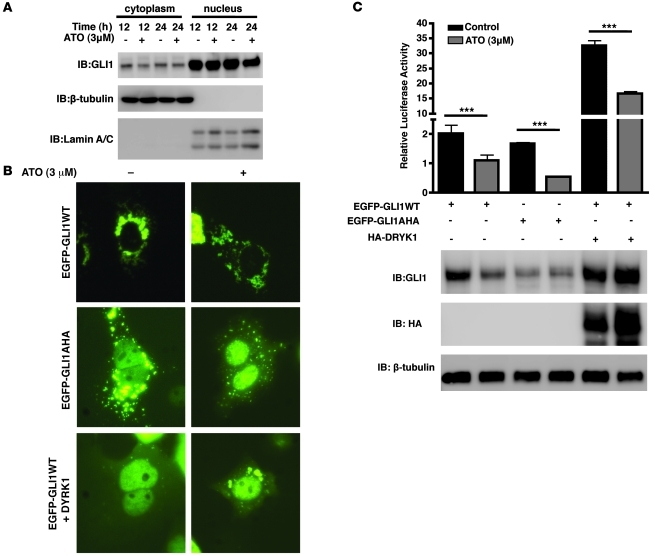
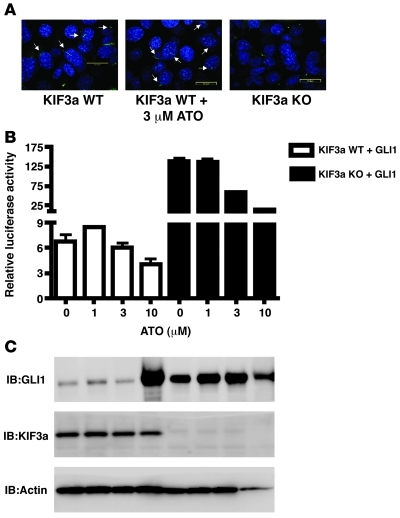
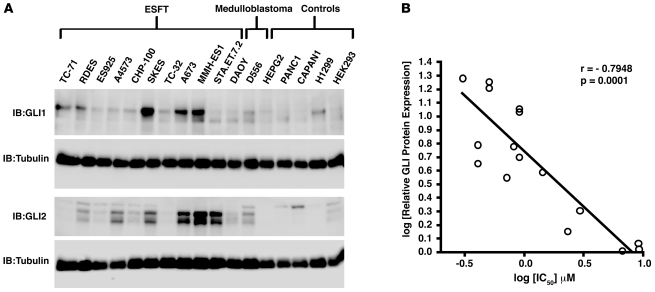
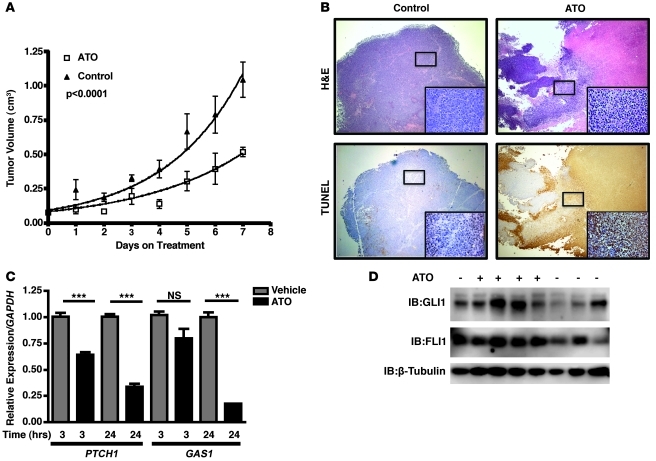
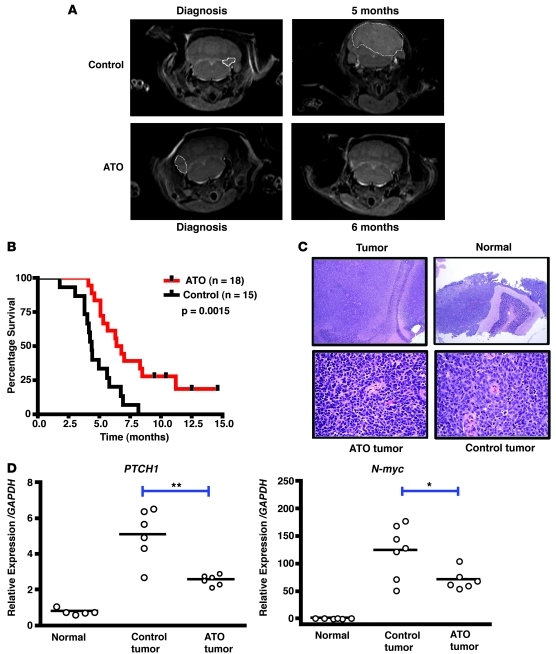
The Hedgehog (Hh) pathway is activated in some human cancers, including medulloblastoma. The glioma-associated oncogene homolog (GLI) transcription factors are critical mediators of the activated Hh pathway, and their expression may be elevated in some tumors independent of upstream Hh signaling. Thus, therapies targeting GLI transcription factors may benefit a wide spectrum of patients with mutations at different nodal points of the Hh pathway. In this study, we present evidence that arsenic trioxide (ATO) suppresses human cancer cell growth and tumor development in mice by inhibiting GLI1. Mechanistically, ATO directly bound to GLI1 protein, inhibited its transcriptional activity, and decreased expression of endogenous GLI target genes. Consistent with this, ATO inhibited the growth of human cancer cell lines that depended on upregulated GLI expression in vitro and in vivo in a xenograft model of Ewing sarcoma. Furthermore, ATO improved survival of a clinically relevant spontaneous mouse model of medulloblastoma with activated Hh pathway signaling. Our results establish ATO as a Hh pathway inhibitor acting at the level of GLI1 both in vitro and in vivo. These results warrant the clinical investigation of ATO for tumors with activated Hh/GLI signaling, in particular patients who develop resistance to current therapies targeting the Hh pathway upstream of GLI.


Figures

Figure 1
Figure 1. ATO inhibits GLI1 protein activity and target gene expression.
(A and B) HepG2 cells were transfected with GLI luciferase reporter construct (pGL38XGLI) and Notch luciferase reporter construct (HES-1) with or without GLI1 and Notch cDNAs, respectively (A), and COS7 cells were transfected with pGL38XGLI and GLI2 constructs (B). Renilla-TK construct was used as transfection control for signal normalization. 24 hours after transfection, cells were treated with ATO for 24 hours. Mean ± SD relative luciferase activity was calculated relative to Renilla activity. Transfection assays were performed in triplicate. Expression of GLI1 and Notch (A) and GLI2 (B) were detected by Western blot. In A, cell viability was measured at the same dose range and plotted on the same graph. (C) TC-71 cells were treated with vehicle or ATO for 12 hours. qRT-PCR was performed to quantify changes in GLI1 mRNA levels as well as PTCH1 and GAS1. Expression was normalized to GAPDH. Mean ± SD relative expression level was calculated using the comparative Ct method. ***P < 0.0001, 2-tailed Student’s t test. Each condition was performed in triplicate. (D) TC-71 total cell lysates from the experiment in C were subject to SDS-PAGE followed by IB with anti-GLI1, anti-FLI1, and anti-actin antibodies.
Figure 2
Figure 2. ATO does not change subcellular localization of GLI1.
(A) TC-71 cells were treated with vehicle or ATO for 12 or 24 hours. Cell fractionation was conducted, and lysates were subject to SDS-PAGE followed by IB with the antibodies anti-GLI1, anti–β-tubulin (control for cytoplasmic proteins), and anti–lamin A/C (control for nuclear proteins). (B) Localization of EGFP-GLI1WT and EGFP-GLI1AHA; EGFP-GLI1WT with HA-DYRK1 was detected by green fluorescence. (C) COS7 cells were transfected with pGL38XGLI and EGFP-GLI1WT, EGFP-GLI1AHA, or EGFP-GLI1WT and HA-DRYK1. The Renilla-TK construct was used as a control for normalization. 24 hours later, cells were treated for 24 hours with 3 μM ATO. Mean ± SD relative luciferase activity was calculated relative to Renilla activity. ***P < 0.0001, 2-tailed Student’s t test. Transfection assays were performed in triplicate. Expression of GLI constructs were detected by Western blot.
Figure 3
Figure 3. ATO does not inhibit GLI1 by affecting primary cilia.
(A) Effects of ATO on primary cilia were visualized using confocal fluorescence microscopy on MEFs stained for acetylated tubulin. Arrows indicate cilium. Scale bars: 20 μm. (B) KIF3a WT and knockout cells were transfected with pGL38XGLI and EGFP-GLI1. The Renilla-TK construct was used as a control for normalization. 24 hours later, cells were treated for 24 hours with ATO at 1, 3, and 10 μM. Mean ± SD relative luciferase activity was calculated relative to Renilla activity. Transfection assays were performed in triplicate. (C) Expression of GLI1 and KIF3a were detected by IB.
Figure 4
Figure 4. ATO directly binds to GLI1.
(A) Coomassie-stained gel shows induction of full-length GLI1 protein expression in bacteria. Protein in the inclusion bodies was bound to Ni+ NTA column, refolded on the column, and eluted with an imidazole gradient. IPTG, isopropyl-D-1-thiogalactopyranoside. (B) 40 nM full-length GLI1 protein was preincubated with either BAL (50 μM for 10 minutes) or ATO (200, 100, 50, and 25 μM for 2 hours). 200 nM FlAsH-EDT was then added for 20 minutes. EWS-FLI1 with 200 nM FlAsH was used as negative control. Fluorescence intensity was measured with excitation at 508 nm and emission at 528 nm; relative fluorescence intensity is expressed as the fold change over the control (FlAsH alone). *P = 0.02, 2-tailed Student’s t test. (C) COS7 cells were transfected with EGFP alone, EGFP-DVL3, and EGFP-GLI1 and then treated with 2.5 μM ReAsH-EDT2 for 1 hour. Colocalization was examined by confocal fluorescence microscopy (all images are at ×600 magnification).
Figure 5
Figure 5. ATO sensitivity correlates with GLI expression.
(A) Whole cell lysates were subject to SDS-PAGE followed by IB with anti-GLI1, anti-GLI2, and anti–β-tubulin antibodies. (B) log relative GLI expression, as measured by densitometry of Western blots in A, versus log IC50 from Table 1. Correlation was assessed using nonparametric Spearman test (r = –0.7948, P = 0.0001).
Figure 6
Figure 6. ATO inhibits ESFT cell proliferation in vivo in a mouse xenograft model.
(A) TC-71 ESFT cells were implanted intramuscularly to SCID mice. When xenografts became palpable, animals were treated with i.p. injections of PBS control (n = 8) or 0.15 mg/kg ATO (n = 8) every other day until their tumors reached 1 cm3 (P < 0.0001, curve regression and F test). (B) Tumors from the mice in A were analyzed by H&E and IHC for TUNEL as a marker of apoptosis. Boxed regions show viable cells presented at higher magnification in the insets. Main panel images are at ×40 and the insets are at ×400 magnification. (C) Mice with TC-71 xenografts were euthanized at 3 and 24 hours after i.p. injection of PBS or 0.15 mg/kg ATO. qRT-PCR was performed in order to quantify changes in GLI target genes PTCH1 and GAS1 of control versus ATO-treated tumors. Expression was normalized to GAPDH levels. Mean ± SD relative expression levels were calculated using the comparative Ct method. ***P < 0.0001, 2-tailed Student’s t test. Each condition was performed in triplicate. (D) Protein was extracted from frozen tumor samples (4 ATO treated, 4 control) and was subject to SDS-PAGE followed by IB with anti-GLI1, anti-FLI1, and anti–β-tubulin antibodies.
Figure 7
Figure 7. Survival of ND2:SMOA1 mice is increased by ATO treatment.
(A) MRI images of representative animals before treatment and 5–6 months after treatment. Dashed circles denote tumors. (B) The survival of ATO-treated (n = 18; 0.15 mg/kg 3 times per week) and untreated (n = 15) ND2:SMOA1 mice were compared (P = 0.0015, Kaplan-Meyer analysis). Tick marks on the graph represent animals that were still alive at the end of the study. (C) Representative H&E sections from control and ATO-treated tumors. In each case, a histologically classical medulloblastoma was observed arising in cerebellum. Low-power images (top) show tumor and normal cerebellum, high-power images (bottom) show tumor. Upper panels images are at ×40 and the lower panel images are at ×400 magnification. (D) qRT-PCR was performed to evaluate changes in GLI target genes PTCH1 and N-myc of control tumors (n = 7), ATO-treated tumors (n = 6), and normal cerebellum (n = 6). Expression was normalized to GAPDH levels. Mean relative expression levels were calculated using the comparative Ct method. *P < 0.05,**P < 0.01, 2-tailed Student’s t test. Each condition was performed in triplicate.

Comment in

References

    1. Hahn H, et al. Mutations of the human homolog of Drosophila patched in the nevoid basal cell carcinoma syndrome. Cell. 1996;85(6):841–851. doi: 10.1016/S0092-8674(00)81268-4. - DOI - PubMed
    1. Pietsch T, et al. Medulloblastomas of the desmoplastic variant carry mutations of the human homologue of Drosophila patched. Cancer Res. 1997;57(11):2085–2088. - PubMed
    1. Reifenberger J, et al. Missense mutations in SMOH in sporadic basal cell carcinomas of the skin and primitive neuroectodermal tumors of the central nervous system. Cancer Res. 1998;58(9):1798–1803. - PubMed
    1. Berman DM, et al. Medulloblastoma growth inhibition by hedgehog pathway blockade. Science. 2002;297(5586):1559–1561. doi: 10.1126/science.1073733. - DOI - PubMed
    1. Regl G, et al. Human GLI2 and GLI1 are part of a positive feedback mechanism in Basal Cell Carcinoma. Oncogene. 2002;21(36):5529–5539. doi: 10.1038/sj.onc.1205748. - DOI - PubMed

Publication types

MeSH terms