. 2011 Jan 7;144(1):143-56.
doi: 10.1016/j.cell.2010.11.052. Epub 2010 Dec 23.

Phenotypic landscape of a bacterial cell

Affiliations

Phenotypic landscape of a bacterial cell

Robert J Nichols et al. Cell. .

Abstract

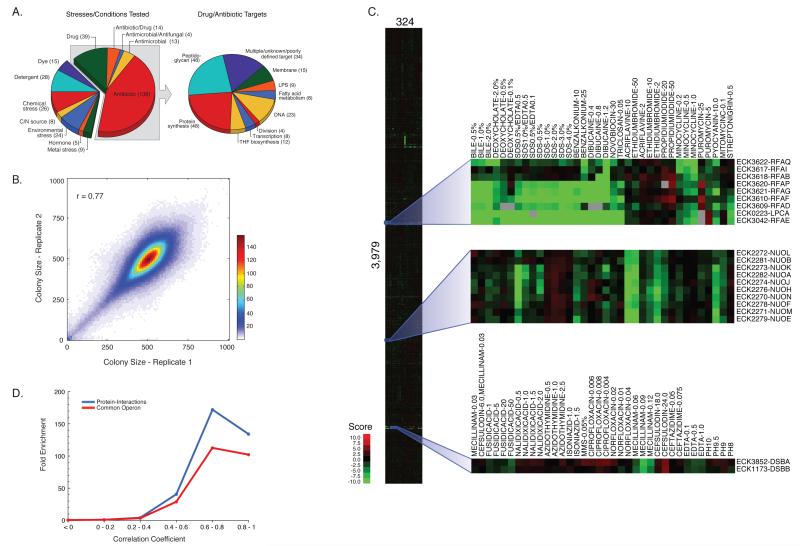
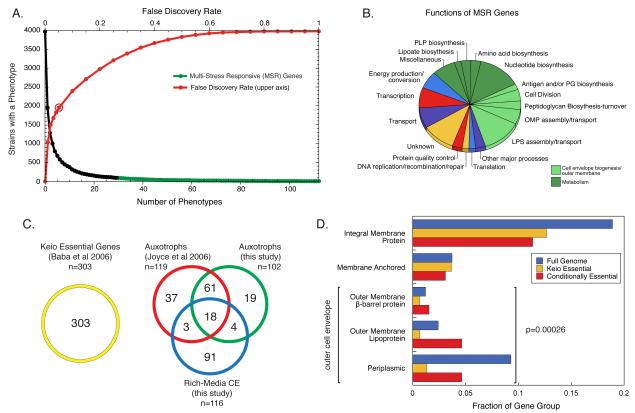
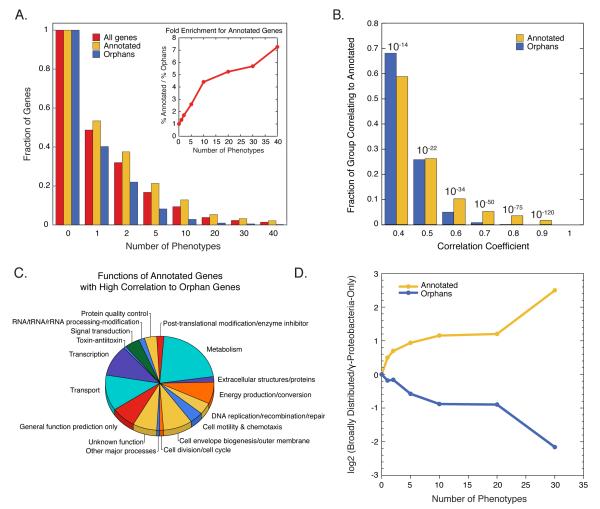
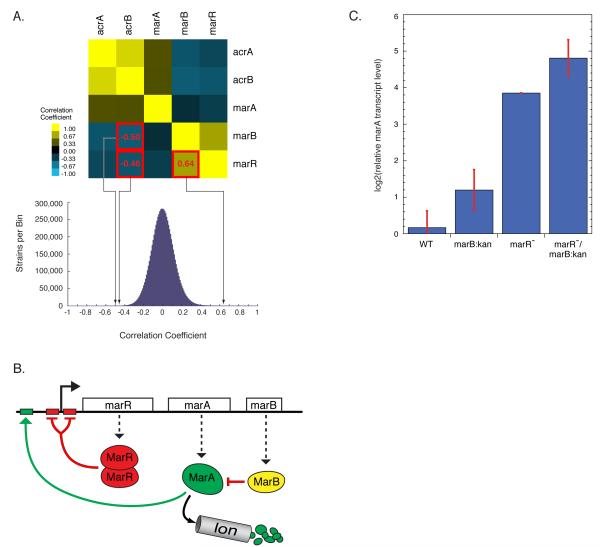
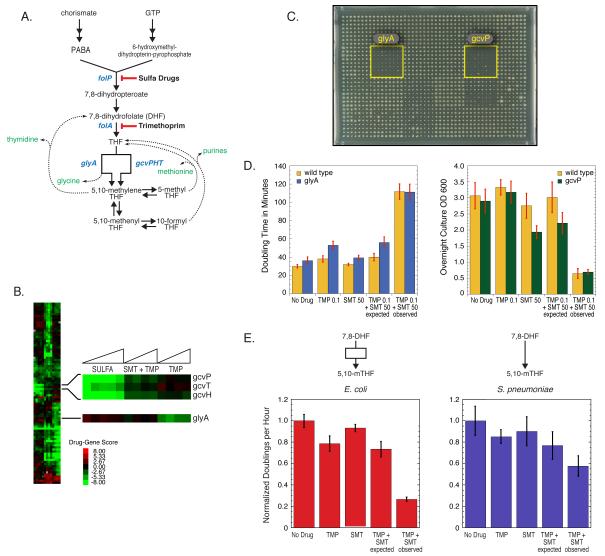
The explosion of sequence information in bacteria makes developing high-throughput, cost-effective approaches to matching genes with phenotypes imperative. Using E. coli as proof of principle, we show that combining large-scale chemical genomics with quantitative fitness measurements provides a high-quality data set rich in discovery. Probing growth profiles of a mutant library in hundreds of conditions in parallel yielded > 10,000 phenotypes that allowed us to study gene essentiality, discover leads for gene function and drug action, and understand higher-order organization of the bacterial chromosome. We highlight new information derived from the study, including insights into a gene involved in multiple antibiotic resistance and the synergy between a broadly used combinatory antibiotic therapy, trimethoprim and sulfonamides. This data set, publicly available at http://ecoliwiki.net/tools/chemgen/, is a valuable resource for both the microbiological and bioinformatic communities, as it provides high-confidence associations between hundreds of annotated and uncharacterized genes as well as inferences about the mode of action of several poorly understood drugs.


Figures

Figure 1
Figure 1. Phenomic Profiling of the enhanced Keio Collection yields a robust and rich dataset
(A) Classification of the 324 stresses screened (left), and cellular targets of the antibiotic/antimicrobial/drug classes (right). (B) Heat map representation of scatter plot comparing normalized colony sizes in pixels of plate replicates 1 and 2 across the entire dataset. Bins indicate the square root of the number of replicate pairs within a 10 × 10 pixel window as depicted by color scale. Note that the vast majority of the replicates have highly correlated colony sizes. (C) Clustergram of fitness scores for 3979 mutant strains in response to all 324 conditions. Zoomed insets demonstrate co-clustering of conditions (x-axis) and genes (y-axis) for a common pathway (rfa cluster), and protein complexes encoded in the same operon (nuo) or in different operons (dsbA and dsbB). Gray boxes indicate missing data. (D) High correlation between a pair of phenotypic signatures is predictive of shared protein interaction and/or operon membership.
Figure 2
Figure 2. Identification of responsive and conditionally-essential genes
(A) Using a 5% false discovery rate (FDR), 49% of strains tested had at least one phenotype (open circle on the red line). As the FDR is relaxed, more phenotypes are identified (red line). At 5% FDR, some strains have several phenotypes (black) and very few (2.3%; 94 strains) have 30 or more phenotypes (green, Multi-Stress Responsive (MSR) genes). (B) MSR genes participate in a wide variety of cellular processes, particularly those related to metabolism and the cell envelope. Genes were manually curated to COG-based functions; each gene was allowed to belong only to a single function. (C) 196 genes are conditionally-essential (CE) in this study. Of these, roughly half have been previously described as CE due to auxotrophy. Note that some auxotrophic genes also display a no growth phenotype in at least one rich medium condition and are classified jointly as auxotroph and rich media CE. (D) Rich media CE gene products are enriched in the outer cell envelope (periplasm and outer membrane) relative to Keio essential genes (p=0.00026), highlighting the importance of this compartment in tolerating stress. The cytoplasmic gene category is not displayed here, but is not enriched for CE gene products.
Figure 3
Figure 3. Phenomic profiling identifies phenotypes for orphan gene mutants
(A) Cumulative distribution of phenotypes indicating the fraction of gene mutants in each class having at least the number of phenotypes shown on the X-axis. The plot reveals that orphan gene mutants have phenotypes, but tend to have fewer phenotypes than annotated gene mutants. The insert quantifies phenotype deficit of orphan mutants. (B) Cumulative distribution of highly correlated pairs identifies many orphan genes that correlate highly to an annotated gene, providing high confidence clues to the function of the orphan gene. Values shown above each pair of bars are the p-values associated with pairwise correlation of any two strains at the indicated correlation coefficients. (C) High confidence correlations between orphans and annotated genes (r≥ 0.5) provide leads related to many different cellular functions. Procedure for functional assignment is described in Fig. 2. Note that several “annotated genes” were classified as genes of “unknown function” or “general function prediction only” after manual curation. (D) Annotated genes responsible for many phenotypes tend to be broadly conserved, while the most responsive orphan genes tend to be restricted to γ-proteobacteria.
Figure 4
Figure 4. A function for marB
(A) marR and marB phenotypic signatures are highly correlated with each other, and are highly anticorrelated with that of acrB (top). The bottom graph positions these correlations in a histogram showing all pair-wise correlation coefficients between the 3979 mutants. (B) Schematic of the E. coli multiple antibiotic resistance (mar) operon. marB is a gene of unknown function, but our results suggest it encodes a protein that inhibits MarA. (C) RT-PCR analysis shows that marA transcription is derepressed in marB cells. Derepression is independent of and additive with that of marR.
Figure 5
Figure 5. A new network feature contributing to anti-folate drug synergy
(A) Schematic of the E. coli tetrahydrofolate (THF) biosynthesis pathway and the enzymatic steps inhibited by Sulfa and TMP. (B) Clustergram of genes that respond to Sulfa, TMP, or the combination. Zoomed image indicates that gcv mutants are sensitive to Sulfa, glyA is sensitive to TMP, and that these four mutants exhibit essentially wildtype growth in response to the drug combination. (C) glyA and gcvP are a synthetic lethal pair. Image of a plate mating between the donor Hfr gcvP::cat and 24 kanR recipients (arrayed in boxes of 8×8 colonies), grown on kanamycin/chloramphenicol medium to select for double mutant strains; position of the glyA::kan and gcvP::kan recipients is highlighted. (D) Liquid culture experiments verify growth phenotypes on agar plates shown in Fig.5B. The deviation of the observed from the expected value for the TMP/SMT combination denotes the degree of synergy of the two drugs, which is lower for glyA and gcvP cells compared to wild-type cells. Concentrations shown for TMP and SMT are in μg/mL. (E) Quantification of synergy in E. coli and S. pneumoniae, which lacks the branched pathway for generating 5,10-mTHF present in E. coli. Comparisons were performed using single drug concentrations giving equivalent inhibition of both organisms. S. pneumoniae has reduced synergy compared to E. coli.
Figure 6
Figure 6. Phenomic profiling generates insights into genome organization
(A) Essential and responsive genes are biased to the plus strand of DNA (transcription direction coincident with replication) and the non-responsive genes are biased to the minus strand of DNA. (B-C) For each panel, circular plots depict gene position, adjusting coordinates so that the chromosome starts at the origin of replication (oriC = 0 bp); the terminus region (ter) is opposite the oriC. Each trace represents spatial enrichment for the variable plotted based on a 100kb sliding window. Three dashed lines of the same color accompany each trace indicating the minimum permutation threshold, the baseline representing zero enrichment, and the maximum permutation threshold (inside to outside). Permutation thresholds are the result of 1000 randomizations of gene class assignments (see Experimental Procedures), and indicate significant negative and positive spatial enrichment at a p-value of 0.05. (B) Responsive and CE genes are concentrated around the oriC, and scarce around the terminus. (C) The terminus is positively enriched for genes restricted to the γ-proteobacteria, and negatively enriched for broadly conserved genes.
Figure 7
Figure 7. Network view reveals new insights into drug action
(A) Colored nodes represent all drugs profiled in this study found to have significant interactions with Gene Ontology (GO) biological process groups (gray nodes). Connections between nodes represent significant Drug-GO interactions (p-value ≤10−3, gray) or high Drug-Drug correlation (r≥0.32, p-value ≤10−97, yellow). Drug node size is based on the number of connections associated with that node, i.e. larger nodes have more Drug-GO interactions. Spatial clustering is driven by the p-values of Drug-GO interactions and Drug-Drug correlations, resulting in drugs with similar cellular action lying near each other in the network. Drugs with multiple, unknown, or poorly defined targets are shown in dark blue. (B) Zoomed view of subnetwork shadowed by light blue box in (A). All four quinolones screened (orange) interact negatively with xseAB (exonuclease VII) and are the only drugs that require the exonuclease, p-value=10−6. NTF is found to activate the SOS response, and create lesions requiring nucleotide-excision repair (Fig S5B).

References

    1. Baba T, Ara T, Hasegawa M, Takai Y, Okumura Y, Baba M, Datsenko KA, Tomita M, Wanner BL, Mori H. Construction of Escherichia coli K-12 in-frame, single-gene knockout mutants: the Keio collection. Mol Syst Biol. 2006;2:0008. 2006. - PMC - PubMed
    1. Barker CA, Farha MA, Brown ED. Chemical genomic approaches to study model microbes. Chem Biol. 2010;17:624–632. - PubMed
    1. Beltrao P, Cagney G, Krogan NJ. Quantitative genetic interactions reveal biological modularity. Cell. 2010;141:739–745. - PMC - PubMed
    1. Bochner BR. Global phenotypic characterization of bacteria. FEMS Microbiol Rev. 2009;33:191–205. - PMC - PubMed
    1. Bollenbach T, Quan S, Chait R, Kishony R. Nonoptimal microbial response to antibiotics underlies suppressive drug interactions. Cell. 2009;139:707–718. - PMC - PubMed

Publication types