. 2011 Apr;274(1-2):48-60.
doi: 10.1016/j.heares.2010.12.016. Epub 2010 Dec 24.

Physiological differences between histologically defined subdivisions in the mouse auditory thalamus

Affiliations

Physiological differences between histologically defined subdivisions in the mouse auditory thalamus

Lucy A Anderson et al. Hear Res. 2011 Apr.

Abstract

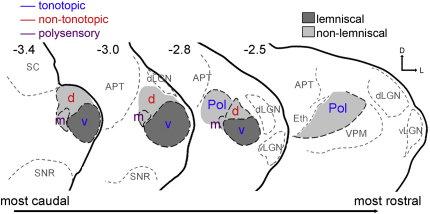
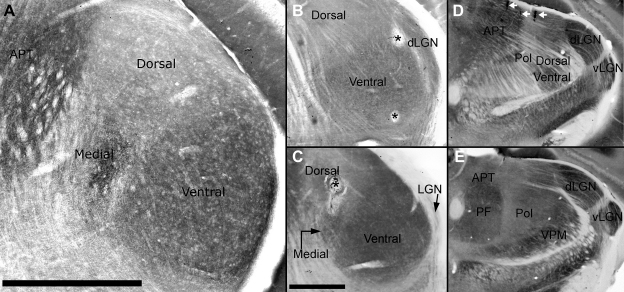
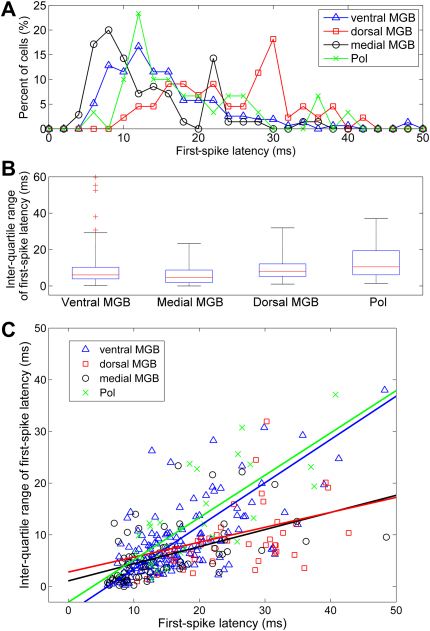
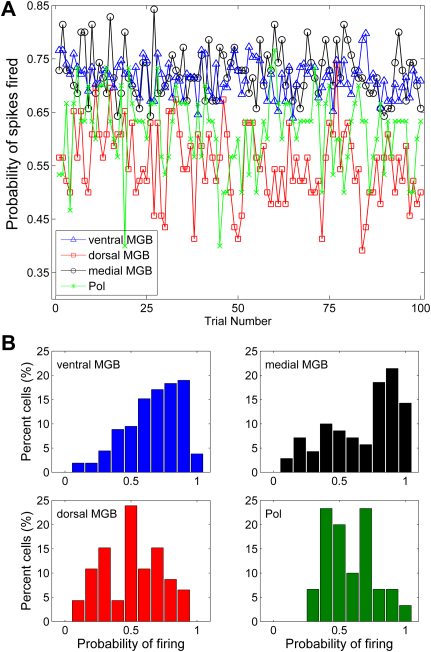
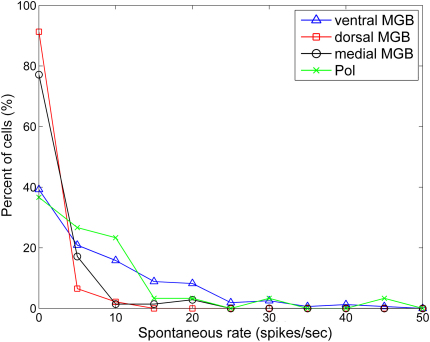
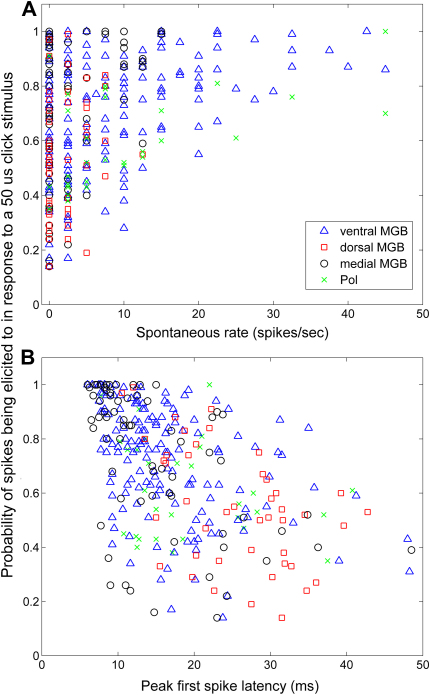
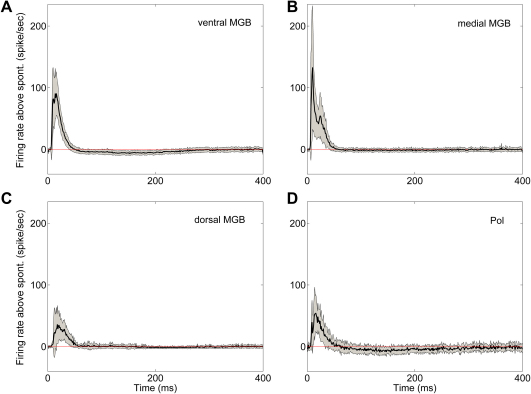
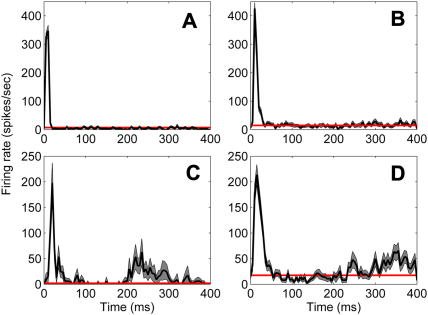
The auditory thalamic area includes the medial geniculate body (MGB) and the lateral part of the posterior thalamic nucleus (Pol). The MGB can be subdivided into a ventral subdivision, forming part of the lemniscal (primary) auditory pathway, and medial and dorsal subdivisions, traditionally considered (alongside the Pol) part of the non-lemniscal (secondary) pathway. However, physiological studies of the auditory thalamus have suggested that the Pol may be more appropriately characterised as part of the lemniscal pathway, while the medial MGB may be part of a third (polysensory) pathway, with characteristics of lemniscal and non-lemniscal areas. We document physiological properties of neurons in histologically identified areas of the MGB and Pol in the anaesthetised mouse, and present evidence in favour of a distinctive role for medial MGB in central auditory processing. In particular, medial MGB contains a greater proportion of neurons with short first-spike latencies and high response probabilities than either the ventral or dorsal MGB, despite having low spontaneous rates. Therefore, medial MGB neurons appear to fire more reliably in response to auditory input than neurons in even the lemniscal, ventral subdivision. Additionally, responses in the Pol are more similar to those in the ventral MGB than the dorsal MGB.


Figures

Fig. 1
Fig. 1
Line drawings of four coronal sections through a typical mouse thalamus to show the relative position of the MGB subdivisions and the Pol. Borders have been ascertained on the basis of CYO staining; outlines are left unfinished where a precise border could not be determined in this animal. Auditory areas are outlined in black dashed lines; non-auditory areas are shown by grey dashed lines to help orientate the reader. Areas thought to belong to the lemniscal pathway are shown in dark grey and areas thought to belong to the non-lemniscal pathway are shown in light grey (grey fills are representative only, and are not intended to show definitive boundaries). Blue lettering indicates tonotopic areas, non-tonotopic areas are represented by red lettering and polysensory areas are shown in purple. Sections have a thickness of 40 μm, numbers at the top of each section give an indication of the section’s distance (in mm) behind Bregma. Abbreviations: v, ventral MGB; m, medial MGB; d, dorsal MGB; Pol, lateral part of the posterior thalamic nucleus; APT, anterior pretectal nucleus; d/vLGN, dorsal/ventral lateral geniculate nucleus; Eth, ethmoid thalamic nucleus; PF, parafascicular thalamic nucleus; SC, superior colliculus; SNR, reticular substantia nigra; VPM, ventral posteromedial thalamic nucleus. Orientation bar, D = dorsal, L = lateral.
Fig. 2
Fig. 2
Histological identification of the auditory thalamic subdivisions using cytochrome oxidase. A, coronal section through the MGB stained for cytochrome oxidase. The paler stained dorsal MGB is bounded ventrally by the deeper staining ventral and medial MGB and medially by the anterior pretectal nucleus (APT). B, coronal section through the ventral and dorsal MGB showing two electrolytic lesions (indicated by asterisks) made in the same track where abrupt physiological changes occurred. This physiological judgement was confirmed by the location of the lesions near the borders of the area of higher CYO expression corresponding to the ventral MGB. This section is more rostral than A, and the lateral geniculate nucleus can be observed forming the lateral boundary of the ventral and dorsal MGB. The dLGN is clearly separated from the ventral and dorsal MGB by a band of pale stained fibres. C, asterisk indicates the centre of a large electrolytic lesion made in the centre of dorsal MGB. This section is rostral to A and caudal to B; the very caudal edge of LGN can be observed in the white matter. D, section through the rostral MGB; ventral and dorsal MGB remain just visible and the caudal portion of the paler staining Pol starts to appear within the fibre tracts. White arrowheads at the top of the section indicate stained red blood cells resulting from damage caused by electrode tracks. E, section ∼ 400 μm rostral from the same animal as D, to indicate the volume changes of the Pol on moving rostrally. Scale bar in A = 1 mm, scale bar in C applies to B and C = 500 μm, D and E = 1 mm. Abbreviations as Fig. 1.
Fig. 3
Fig. 3
First-spike latencies. A, line plot showing the percentage distribution of first-spike latencies across the ventral, dorsal & medial MGB, and Pol. B, box and whisker plots of inter-quartile range for first-spike latency, for all four subdivisions. On each box, the central mark is the median, the edges of the box are the 25th and 75th percentiles and the maximum whisker length indicates three times the inter-quartile range; data points outside this range are marked as outliers (+). C, scatterplot comparing inter-quartile range of first-spike latency to first-spike latency. Solid lines indicate two-dimensional least-squares linear fits to the data from each subdivision.
Fig. 4
Fig. 4
Response probabilities. A, mean probability of response (averaged across the population) for each subdivision plotted against each repetition of the click. B, distribution of the probability of spiking in response to the click averaged across all trials for each subdivision.
Fig. 5
Fig. 5
Spontaneous firing rate distributions for all subdivisions.
Fig. 6
Fig. 6
Scatter plots showing the probability of firing versus spontaneous rate (A) and first-spike latency (B). Legend in A also applies to B.
Fig. 7
Fig. 7
Mean PSTH of response to click stimulus, normalised for each neuron by subtracting spontaneous rate, for ventral MGB (A), medial MGB (B), dorsal MGB (C) and Pol (D). Black line indicates mean response; grey area indicates range of standard error of mean.
Fig. 8
Fig. 8
Temporal response characteristics for individual neurons, illustrated by plotting the mean PSTH (black line) and standard error of the mean (grey shading). Spontaneous rate for each cell is indicated by the red line. A, PSTH from a single cell recorded from the medial MGB illustrating an “onset-only” response to the click stimulus. B, PSTH as in A recorded from the ventral MGB. C, PSTH from a single cell from the ventral MGB showing a significant increase in activity at 200 ms following the initial response which returns to baseline by 400 ms. D, PSTH from a single cell also from the ventral MGB showing a significant increase in activity from 300 ms after stimulus onset. The later activity of this cell remains significantly above baseline at the end of the recording.
Fig. 9
Fig. 9
Characteristic frequency and minimum threshold distributions for different auditory thalamic subdivisions. Line plots show the percentage distribution of CF (A) and minimum threshold (B) values for the ventral, dorsal and medial MGB and the Pol.
Fig. 10
Fig. 10
Example frequency-intensity response area shapes recorded from single neurons in the mouse auditory thalamus. All response areas shown were compiled using tone pips varying in frequency from 5 to 75 kHz and in sound level from 15 to 75 dB SPL. Red asterisk and frequency shown in red on the abscissa indicates the characteristic frequency for each neuron. Blue asterisks indicate the low and high frequencies used to calculate the Q20; Q20 values for each neuron are shown in blue in the lower right corner of each plot. Primary-like, level-dependent and inhibitory examples taken from the ventral MGB, narrow neuron from Pol, broad neuron from dorsal MGB, multipeak neuron from medial MGB. Maximum firing for inhibitory example = 20 spikes/sec, all other examples = 100 spikes/sec.
Fig. 11
Fig. 11
Distribution of different frequency-intensity response area shapes in the different auditory thalamic subdivisions.

References

    1. Aitkin L.M. Medial geniculate body of the cat: responses to tonal stimuli of neurons in medial division. J. Neurophysiol. 1973;36:275–283. - PubMed
    1. Aitkin L.M., Dunlop C.W., Webster W.R. Click-evoked response patterns of single units in the medial geniculate body of the cat. J. Neurophysiol. 1966;29:109–123. - PubMed
    1. Andersen R.A., Knight P.L., Merzenich M.M. The thalamocortical and corticothalamic connections of AI, AII, and the anterior auditory field in the cat: evidence for two largely segregated systems of connections. J. Comp. Neurol. 1980;194:663–701. - PubMed
    1. Andersen R.A., Roth G.L., Aitkin L.M., Merzenich M.M. The efferent projections of the central nucleus and pericentral nucleus of the inferior colliculus in the cat. J. Comp. Neurol. 1980;194:649–662. - PubMed
    1. Anderson L.A., Shackleton T.M., Palmer A.R. Association for Research in Otolaryngology; New Orleans, Louisiana, USA: 2005. Responses to amplitude modulation in inferior colliculus and thalamus. Abs.: 974: 341.

Publication types

Substances