

Tuberculin-specific T cells are reduced in active pulmonary tuberculosis compared to LTBI or status post BCG vaccination
- PMID: 21186260
- PMCID: PMC3071115
- DOI: 10.1093/infdis/jiq065
Tuberculin-specific T cells are reduced in active pulmonary tuberculosis compared to LTBI or status post BCG vaccination
Abstract
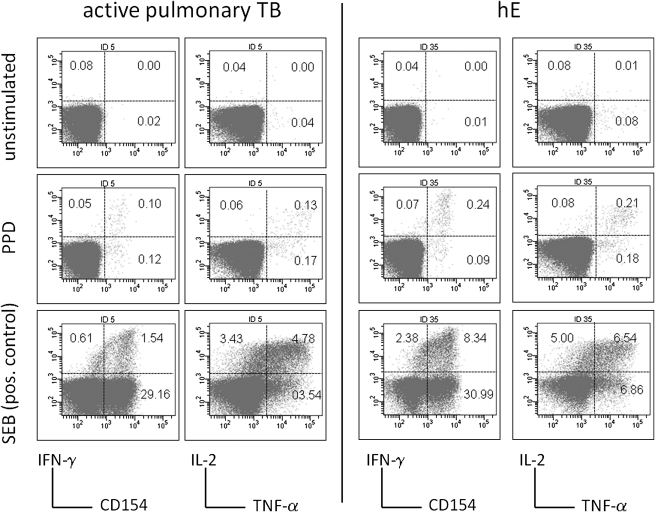
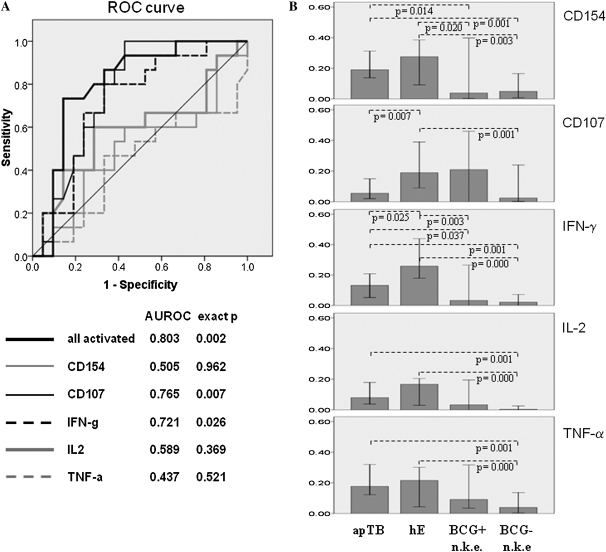
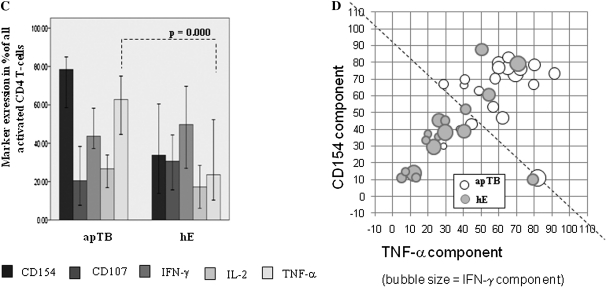
Functional characteristics of tuberculosis (TB)-specific CD4 T cells were studied in clinically active pulmonary TB (n = 21) and high TB exposure including LTBI (n = 17). Following tuberculin stimulation, activated CD4 T cells were identified by flow-cytometry (CD154 up-regulation, degranulation, interferon γ [IFN-γ], tumor necrosis factor α [TNF-α], and interleukin 2 [IL-2\ production). Interestingly, CD154 up-regulation accounted for ∼80% of activated CD4 T cells in the active TB group but just 40% in the controls, whereas IFN-γ accounted for only ∼50% of activated cells in each group. The frequencies of CD4 T cells displaying at least 1 activation marker discriminated better between the groups than those displaying degranulation or IFN-γ production alone.
Figures
Comment in
-
Mycobacterium tuberculosis-Induced Reduction of Interferon {gamma}-Producing CD4 T cells in active tuberculosis.J Infect Dis. 2011 Jul 15;204(2):327; author reply 327-8. doi: 10.1093/infdis/jir251. J Infect Dis. 2011. PMID: 21673046 No abstract available.
References
-
- Diel R, Loddenkemper R, Meywald-Walter K, Niemann S, Nienhaus A. Predictive value of a whole blood IFN-gamma assay for the development of active tuberculosis disease after recent infection with Mycobacterium tuberculosis. Am J Respir Crit Care Med. 2008;177:1164–70. - PubMed
-
- Kaufmann SH. How can immunology contribute to the control of tuberculosis? Nat Rev Immunol. 2001;1:20–30. - PubMed
-
- Keane J, Gershon S, Wise RP, et al. Tuberculosis associated with Infliximab, a Tumor Necrosis Factor {alpha}-neutralizing agent. N Engl J Med. 2001;345:1098–1104. - PubMed
-
- Darrah PA, Patel DT, De Luca PM, et al. Multifunctional TH1 cells define a correlate of vaccine-mediated protection against Leishmania major. Nat Med. 2007;13:843–850. - PubMed
-
- Pantaleo G, Koup RA. Correlates of immune protection in HIV-1 infection: what we know, what we don't know, what we should know. Nat Med. 2004;10:806–810. - PubMed
Publication types
MeSH terms
Substances
LinkOut - more resources
Full Text Sources
Research Materials
