. 2011 Jan 11;108(2):816-21.
doi: 10.1073/pnas.1017914108. Epub 2010 Dec 27.

Arc-dependent synapse-specific homeostatic plasticity

Affiliations

Arc-dependent synapse-specific homeostatic plasticity

Jean-Claude Béïque et al. Proc Natl Acad Sci U S A. .

Abstract

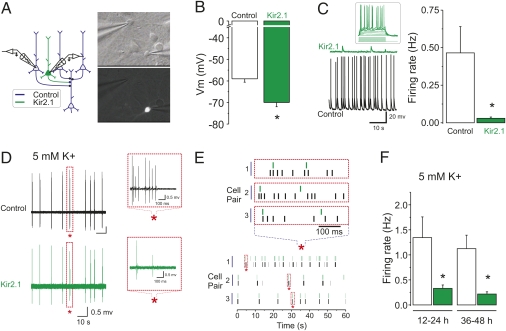
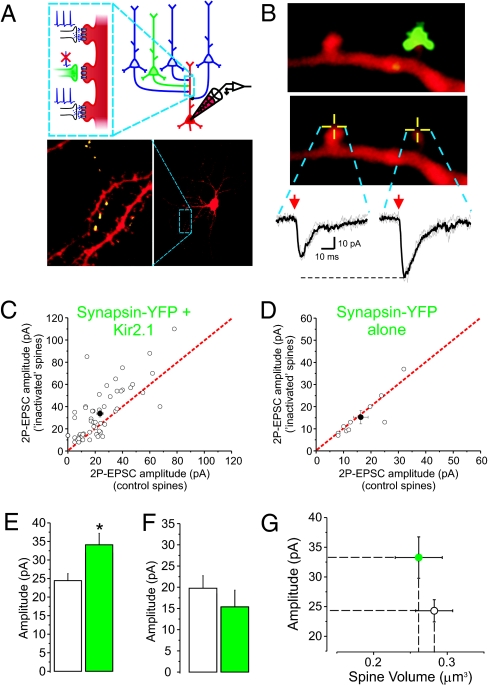
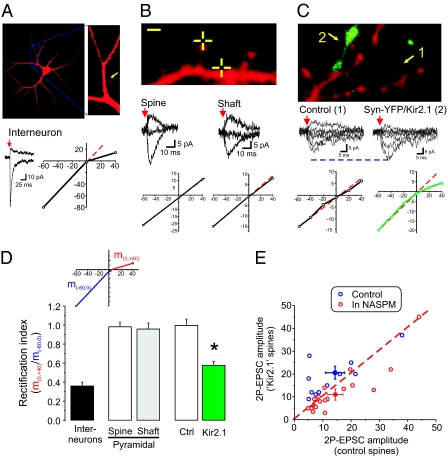
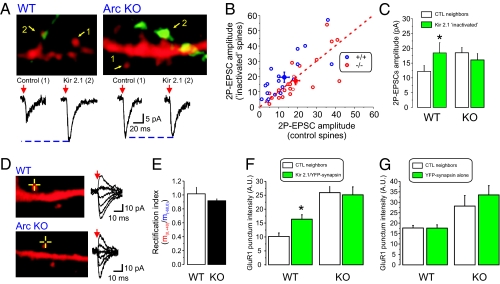
Both theoretical and experimental research has indicated that the synaptic strength between neurons in a network needs to be properly fine-tuned and controlled by homeostatic mechanisms to ensure proper network function. One such mechanism that has been extensively characterized is synaptic homeostatic plasticity or global synaptic scaling. This mechanism refers to the bidirectional ability of all synapses impinging on a neuron to actively compensate for changes in the neuron's overall excitability. Here, using a combination of electrophysiological, two-photon glutamate uncaging and imaging methods, we show that mature individual synapses, independent of neighboring synapses, have the ability to autonomously sense their level of activity and actively compensate for it in a homeostatic-like fashion. This synapse-specific homeostatic plasticity, similar to global synaptic plasticity, requires the immediate early gene Arc. Together, our results document an extra level of regulation of synaptic function that bears important computational consequences on information storage in the brain.


Conflict of interest statement

Conflict of interest statement: Under a licensing agreement between Millipore Corporation and The Johns Hopkins University, R.L.H. is entitled to a share of royalties received by the University on sales of products described in this article. R.L.H. is a paid consultant to Millipore Corporation. The terms of this arrangement are managed by The Johns Hopkins University in accordance with its conflict of interest policies.

Figures

Fig. 1.
Fig. 1.
Overexpression of Kir2.1 leads to a hyperpolarization and reduction of firing of cortical pyramidal neurons. (A) General experimental scheme. (B) Current clamp recordings (nonpaired) showing the resting membrane potential of control (n = 5) and Kir2.1-expressing neurons (n = 5; P < 0.01, unpaired Student's t test). (C) Sample voltage traces from a control and a Kir2.1-overexpressing neuron. The inset shows action potential firing induced by direct current injection from an otherwise silent Kir2.1-expressing neuron. Spontaneous firing activity determined by current clamp recordings (n = 4 each; P < 0.05, unpaired Student's t test) is plotted. (D) Paired simultaneous loose-patch recordings from a control and a Kir2.1-expressing neuron showing synchronous action potential discharge in elevated extracellular K+ (5 mM). Action potential discharge for both recordings is shown with a different timescale in the Insets. The asterisks indicate the region of expansion. (E) Raster plots of action potential discharge are shown for three different paired recordings. The Upper raster plot at an expanded timescale shows action potential skips in the Kir2.1-overexpressing cells. (F) Spontaneous firing activity determined by loose patch recordings is plotted at different times post-transfection procedure (12–24 h, n = 5 pairs, P < 0.05, paired Student's t test; 36–48 h, n = 9 control cells, of which n = 5 were paired recordings with Kir2.1-overexpressing cells, P < 0.05, nonpaired Student's t test).
Fig. 2.
Fig. 2.
Prolonged reduction of glutamate release onto single synapses increases AMPAR function with no apparent change in spine volume. (A) General experimental scheme. (Lower) A confocal image of a pyramidal neuron filled with Alexa 594. Individual synaptic terminals from a neuron transfected with Syn-YFP/Kir2.1 located outside the field of view can be visualized in the vicinity of the recorded neuron. (B) Two neighboring spines with or without overlay of the Syn-YFP terminals from a Syn-YFP/Kir2.1-overexpressing cell. 2P uncaging of MNI-glutamate was elicited at the tip of these spines (yellow crossed lines) and the resulting AMPAR-mediated synaptic current (2P-EPSC) is shown (Vh = −60 mV). (C) For each field of view, the amplitude of control spines (x axis) and that of Syn-YFP apposed spines (y axis) are plotted (n = 55 pairs of control and nearby Syn-YFP/Kir2.1 apposed spines; P < 0.01, paired Student's t test). Each pair is illustrated by an open circle in this and all subsequent scatter plots. The solid circle illustrates the average ± SEM for the population. The red dotted line indicates equal values of 2P-EPSCs (i.e., 2P-EPSCs elicited from two populations of spines not significantly different from one another will lead to clustering along this dotted line). (D) The amplitudes of 2P-EPSCs elicited at control spines and at spines apposed by a Syn-YFP alone terminal were not significantly different (n = 10 pairs; P = 0.51, paired Student's t test). (E) The average amplitude of 2P-EPSCs from control (n = 101) and Syn-YFP/Kir2.1 spines (n = 56; P < 0.01, unpaired Student's t test) is plotted. (F) The average amplitude of 2P-EPSCs from control (n = 21) and Syn-YFP alone spines (n = 10; P = 0.37, unpaired Student's t test) is plotted. (G) The volumes of spines from which we obtained uncaging values for the plots depicted in C and E were not different from one another (n = 101 control spines and n = 56 Kir2.1; P = 0.62, unpaired Student's t test). For comparison purposes, the average amplitude of 2P-EPSCs is also shown in this plot.
Fig. 3.
Fig. 3.
Prolonged inhibition of glutamate release onto single synapses leads to a synapse-specific insertion of GluA2-lacking AMPARs. (A) Confocal image of an interneuron in cortical cultures. The yellow arrow depicts the location of the uncaging spot. Current traces show AMPAR-mediated 2P-EPSCs elicited while voltage clamping the neuron at −60 mV and +40 mV. (B) The crossed line depicts the location of the uncaging spot, i.e., at the tip of a spine or onto the shaft region of the dendrite of this pyramidal neuron. The resulting 2P-EPSCs were nonrectifying for both subcellular locations. (C) A dendritic segment of a pyramidal neuron showing one spine clearly apposed by Syn-YFP/Kir2.1 puncta. Current traces depicting AMPAR-mediated 2P-EPSCs obtained while voltage clamping the neuron at different membrane potential are shown along with their respective I–V curve. (D) A rectification index was computed for these conditions. The index, schematized in the Inset, is the ratio of the slope of the outward conductance region of the I–V curve (m0,+40mV) over that of the inward conductance region (m−60,0mV). (Interneurons, n = 7; spines, n = 10; extrasynaptic regions, n = 7; control neighbor, n = 8; Syn-YFP/Kir2.1, n = 11). (E) The amplitude of 2P-EPSCs obtained for control spines is plotted against those for Syn-YFP/Kir2.1 spines for each field of view. Data are shown for experiments in the absence (n = 11 pairs, P < 0.05, paired Student's t test; blue circles) and in the presence of NASPM (n = 19 pairs, P < 0.05, paired Student's t test; red circles).
Fig. 4.
Fig. 4.
Synapse-specific insertion of AMPARs at Kir2.1/Syn-YFP spines is abolished in Arc KO neurons. (A and B) Dendritic segments from WT (A) and Arc KO (B) pyramidal neurons and the synaptic terminals from a Kir2.1/Syn-YFP–expressing neuron and associated current traces of 2P-EPSCs are shown. (B) The amplitude of 2P-EPSCs at control neighboring spines is plotted against the amplitude of 2P-EPSCs obtained from Kir2.1/Syn-YFP spines for WT (n = 18 pairs, P < 0.01, paired Student's t test; blue circles) and Arc KO neurons (n = 25 pairs, P = 0.54, paired Student's t test; red circles). (C) The average amplitude of 2P-EPSCs is plotted for WT (n = 27 control spines, n = 18 Kir2.1/Syn-YFP apposed spines; P < 0.05, unpaired Student's t test) and for KO (n = 55 control spines, n = 35 Kir/Syn-YFP spines; P = 0.14, unpaired Student's t test). (D) Dendritic segments from a WT and a KO neuron showing current traces depicting AMPAR-mediated 2P-EPSC elicited while holding the neuron at −60, −40, −20, 0, +20, and +40 mV. (E) Average rectification index obtained in WT (n = 11) and ARC KO (n = 23; P = 0.12, unpaired Student's t test). (F) Surface GluA1 labeling intensity at control and Kir2.1/Syn-YFP apposed synapses for WT neurons (n = 25 pairs; P < 0.01, paired Student's t test) and Arc KO neurons (n = 32 pairs; P = 0.62, paired Student's t test). (G) Surface GluA1 labeling intensity at control and Syn-YFP alone apposed synapses for WT neurons (n = 26 pairs; P = 0.97, paired Student's t test) and Arc KO neurons (n = 20 pairs; P = 0.09, paired Student's t test).

References

    1. Abbott LF, Nelson SB. Synaptic plasticity: Taming the beast. Nat Neurosci. 2000;3(Suppl):1178–1183. - PubMed
    1. Turrigiano GG. The self-tuning neuron: Synaptic scaling of excitatory synapses. Cell. 2008;135:422–435. - PMC - PubMed
    1. O'Brien RJ, et al. Activity-dependent modulation of synaptic AMPA receptor accumulation. Neuron. 1998;21:1067–1078. - PubMed
    1. Shepherd JD, et al. Arc/Arg3.1 mediates homeostatic synaptic scaling of AMPA receptors. Neuron. 2006;52:475–484. - PMC - PubMed
    1. Turrigiano GG, Leslie KR, Desai NS, Rutherford LC, Nelson SB. Activity-dependent scaling of quantal amplitude in neocortical neurons. Nature. 1998;391:892–896. - PubMed

Publication types

Substances

LinkOut - more resources