. 2011 Jan 11;108(2):603-8.
doi: 10.1073/pnas.1010954108. Epub 2010 Dec 27.

Nonspecific binding limits the number of proteins in a cell and shapes their interaction networks

Affiliations

Nonspecific binding limits the number of proteins in a cell and shapes their interaction networks

Margaret E Johnson et al. Proc Natl Acad Sci U S A. .

Abstract

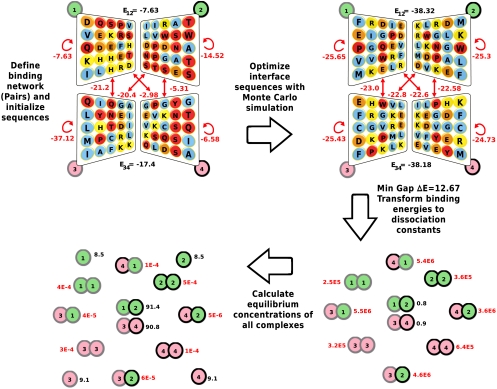
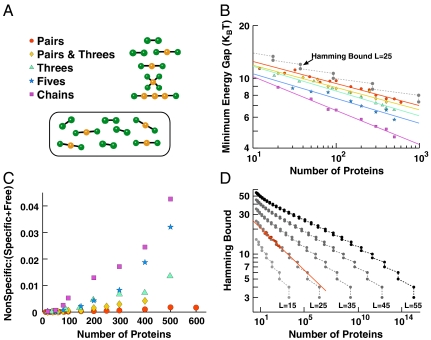
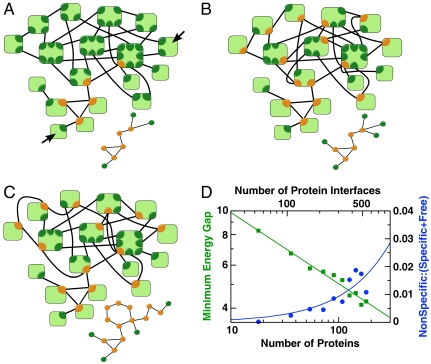
Multicellular organisms, from Caenorhabditis elegans to humans, have roughly the same number of protein encoding genes. We show that the need to prevent disease-causing nonspecific interactions between proteins provides a simple physical reason why organism complexity is not reflected in the number of distinct proteins. By collective evolution of the amino acid sequences of protein binding interfaces we estimate the degree of misbinding as a function of the number of distinct proteins. Protein interaction energies are calculated with an empirical, residue-specific energy function tuned for protein binding. We show that the achievable energy gap favoring specific over nonspecific binding decreases with protein number in a power-law fashion. From the fraction of proteins involved in nonspecific complexes as a function of increasing protein number and decreasing energy gap, we predict the limits these binding requirements place on the number of different proteins that can function effectively in a given cellular compartment. Remarkably, the optimization of binding interfaces favors networks in which a few proteins have many partners, and most proteins have few partners, consistent with a scale-free network topology. We conclude that nonspecific binding adds to the evolutionary pressure to develop scale-free protein-protein interaction networks.


Conflict of interest statement

The authors declare no conflict of interest.

Figures

Fig. 1.
Fig. 1.
Schematic of the sequence optimization formalism, illustrated for a Pairs interaction network. (Top Left) The initial random sequences of four protein interfaces are part of a larger set of N = 200 interfaces. In the figure, specific partners are lined up horizontally and bind as in a book to be closed. Hydrophobic residues are colored blue, polar residues are red, and positively and negatively charged residues are colored yellow and orange, respectively. The two specific interaction energies E12 and E34 are shown in black (in units of kBT), and all the nonspecific ones in red (including those for self-binding, as indicated by circular arrows). Each protein is labeled from 1 to 4 (pink and green circles), and these labels are maintained in the other panels. (Top Right) After sequence optimization, the specific binding energies are more negative, and the gap to the nonspecific interactions has widened. (Bottom Right) From the binding energies, pairwise dissociation constants (in units of nM) are calculated for the two specific (black) and the eight nonspecific complexes (red). (Bottom Left) From the dissociation constants, and for total concentrations of 100 nM of each of the proteins, equilibrium concentrations (in nM) are calculated for all complexes and the free proteins.
Fig. 2.
Fig. 2.
Specific and nonspecific binding of proteins in simple interaction networks. (A) Basic topological units of the protein–protein interaction networks. Orange and green circles represent shared and unshared interfaces, respectively, and black lines indicate specific binding. The units are replicated to create networks, as illustrated in the oval for a Pairs and Threes network with N = 20 proteins. (B) Minimum-energy gap ΔE for networks of N proteins. Optimal gaps (symbols as in A) were found by MC optimization of interfaces with L = 25 amino acids. The gray dashed line is the Hamming bound of the binary model, scaled by an arbitrary factor 2/3 for comparison. Solid lines are power-law fits, with scaling exponents γ = 0.13 for the Pairs topology, 0.13 for Pairs and Threes in a 1∶1 ratio, 0.14 for Threes, 0.14 for Fives, and 0.19 for Chains. We also optimized the Pairs topology with different contact potentials. For the Betancourt–Thirumalai (30) and Skolnick et al. (29) potentials, we obtained γ = 0.12 and 0.13, respectively. (C) Concentration of proteins bound in nonspecific complexes, normalized by the concentration bound in specific complexes and free in solution. Individual protein concentrations are set at 100 nM each. With fixed total protein concentration the results are similar (SI Text and Fig. S5). Data are averaged over the two configurations of protein sequences with the largest minimum-energy gaps. (D) Hamming bound (34) on the minimum gap for N binary sequences of length L. For comparison, the gap of the Pairs network in B and the corresponding power law are shown as red symbols and line, multiplied by an arbitrary factor of 1.65.
Fig. 3.
Fig. 3.
Fragment of yeast protein–protein interaction network. (A) Component of the yeast interactome (14) with all unique binding interfaces explicitly indicated. The shared interfaces on each light green protein are shown in orange, and the unshared interfaces are in dark green. The separate small graph shows the largest connected component. (B) Modified network with one unshared (dark green) interface removed from each available protein in A. The edge is then reconnected to the same protein by a remaining interface such that the protein–protein interaction network is unchanged (in contrast to the interface network). By reducing the number of interfaces from 52 to 40, this procedure decreases the combinatorial number of possible nonspecific interactions, but creates 12 new shared interfaces. In B the edges are reconnected specifically to avoid chains of interactions, creating a minimally connected network. For this network, the reduction in interfaces outweighs the introduction of new shared interfaces and the minimum-energy gap is higher than in the original network. (C) Modified network with number of interfaces reduced to 40, as in B, but with edges reconnected to maximize the creation of chains of interactions. This procedure results in a highly connected component (smaller graph) that constrains the sequences in the optimization and results in a smaller energy gap than either in A or in B. (D) Minimum-energy gap (green, left scale) and concentration of nonspecific complexes normalized by the sum of specific and free protein concentrations (blue, right scale), as a function of the number N of proteins (bottom scale) and binding interfaces (top scale). Individual protein concentrations are set at 100 nM. Interactomes in A were replicated and connected by added interfaces indicated by black arrows. The scaling exponent of the minimum-energy gap is γ = 0.29.

References

    1. Clamp M, et al. Distinguishing protein-coding and noncoding genes in the human genome. Proc Natl Acad Sci USA. 2007;104:19428–19433. - PMC - PubMed
    1. Claverie J-M. What if there are only 30,000 human genes? Science. 2001;291:1255–1257. - PubMed
    1. Huang LL, Guan RJ, Pardee AB. Evolution of transcriptional control from prokaryotic beginnings to eukaryotic complexities. Crit Rev Eukaryotic Gene Expression. 1999;9:175–182. - PubMed
    1. Bird AP. Gene number, noise reduction and biological complexity. Trends Genet. 1995;11:94–100. - PubMed
    1. Nilsen TW, Graveley BR. Expansion of the eukaryotic proteome by alternative splicing. Nature. 2010;463:457–463. - PMC - PubMed

Publication types

LinkOut - more resources