. 2010 Dec 16;6(12):e1001223.
doi: 10.1371/journal.ppat.1001223.

H2A.Z demarcates intergenic regions of the plasmodium falciparum epigenome that are dynamically marked by H3K9ac and H3K4me3

Affiliations

H2A.Z demarcates intergenic regions of the plasmodium falciparum epigenome that are dynamically marked by H3K9ac and H3K4me3

Richárd Bártfai et al. PLoS Pathog. .

Abstract

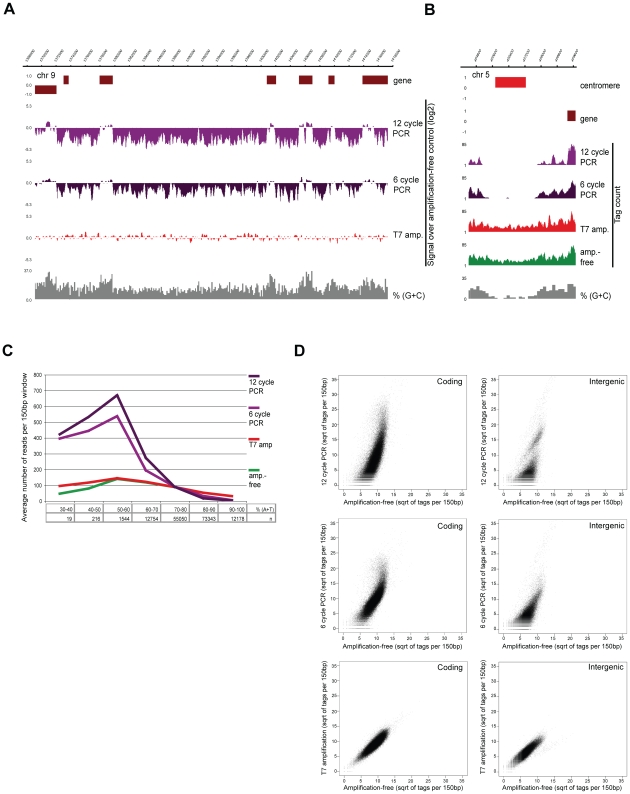
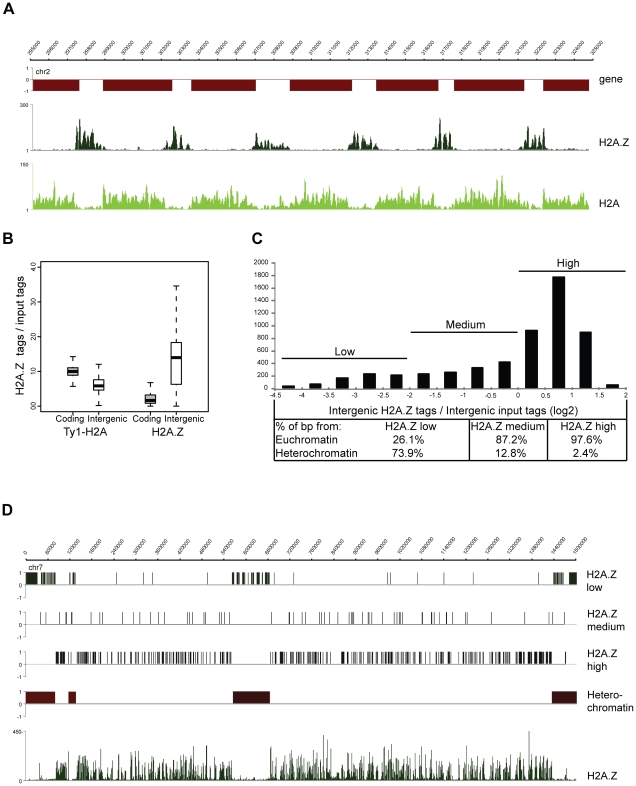
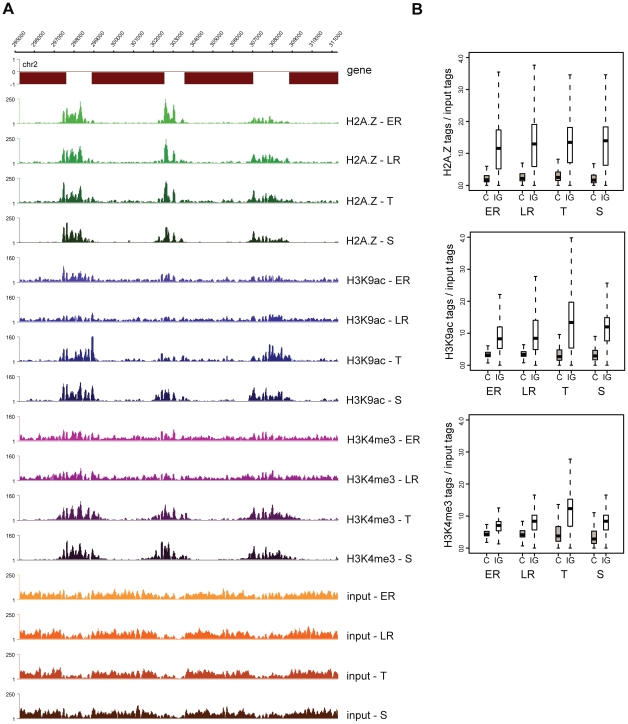
Epigenetic regulatory mechanisms and their enzymes are promising targets for malaria therapeutic intervention; however, the epigenetic component of gene expression in P. falciparum is poorly understood. Dynamic or stable association of epigenetic marks with genomic features provides important clues about their function and helps to understand how histone variants/modifications are used for indexing the Plasmodium epigenome. We describe a novel, linear amplification method for next-generation sequencing (NGS) that allows unbiased analysis of the extremely AT-rich Plasmodium genome. We used this method for high resolution, genome-wide analysis of a histone H2A variant, H2A.Z and two histone H3 marks throughout parasite intraerythrocytic development. Unlike in other organisms, H2A.Z is a constant, ubiquitous feature of euchromatic intergenic regions throughout the intraerythrocytic cycle. The almost perfect colocalisation of H2A.Z with H3K9ac and H3K4me3 suggests that these marks are preferentially deposited on H2A.Z-containing nucleosomes. By performing RNA-seq on 8 time-points, we show that acetylation of H3K9 at promoter regions correlates very well with the transcriptional status whereas H3K4me3 appears to have stage-specific regulation, being low at early stages, peaking at trophozoite stage, but does not closely follow changes in gene expression. Our improved NGS library preparation procedure provides a foundation to exploit the malaria epigenome in detail. Furthermore, our findings place H2A.Z at the cradle of P. falciparum epigenetic regulation by stably defining intergenic regions and providing a platform for dynamic assembly of epigenetic and other transcription related complexes.


Conflict of interest statement

The authors have declared that no competing interests exist.

Figures

Figure 1
Figure 1. T7 amplification results in perfectly representative libraries for Illumina sequencing.
(A–B) Screenshots of sequencing data of P. falciparum genomic DNA prepared by different amplification methods on (A) a part of chr9 (log2-ratio plots of the sequencing data obtained after amplification over amplification-free control) and (B) the centromeric regions of chr5 (76 bp sequence reads plotted per 10 bp window) (C) distribution of sequence reads in relation to AT-content (“n” refers to the number of 150 bp windows with given AT-content, y-axis displays average number of tags per 150 bp window) (D) Scatterplot analysis of amplified sequencing data against amplification-free gold standard in 150 bp windows across GC-richer coding and AT-rich intergenic regions of the P. falciparum genome.
Figure 2
Figure 2. H2A.Z localizes to euchromatic intergenic regions.
(A) Screenshots of the H2A.Z and H2A-Ty1 ChIP-seq coverage plots obtained from schizont stage parasites (B) Box-plot displaying the ratios of ChIP'ed vs mono-nucleosomal input DNA tag counts in every coding and intergenic regions of the P. falciparum genome. (C) Distribution of H2A.Z over mono-nucleosomal input tag counts in intergenic regions displayed as a histogram and their separation to three categories (low, medium, high). Table lists the percent of basepairs for each category located in heterochromatic vs. euchromatic domains of the P. falciparum epigenome. (D) Localization of intergenic regions with different H2A.Z occupancy (from C) across entire chromosome 7. H2A.Z coverage plot is included at the bottom.
Figure 3
Figure 3. H2A.Z occupancy is invariable, while H3K9ac and H3K4me3 marking is dynamic through the intraerythrocytic cycle.
(A) Screenshots of the H2A.Z, H3K9ac and H3K4me3 ChIP-seq and mono-nucleosomal input coverage plots at four stages of intraerythrocytic development (ER: early ring; LR: late ring; T: trophozoite; S: schizont) (B) Box-plot displaying the ratios of ChIP'ed vs mono-nucleosomal input DNA tag counts in every coding and intergenic region of the P. falciparum genome at four stages of intraerythrocytic development.
Figure 4
Figure 4. H3K9 acetylation dynamically associates with transcriptional activity during intraerythrocytic development.
(A) Heatmap representation of the relative transcriptional activity of ∼3800 euchromatic genes and relative H2A.Z occupancy or H3K9ac/H3K4me3 marking upstream of genes throughout intraerythrocytic development (1 equals to the sum of occupancy values at all stages). 12 groups of genes were identified based on their transcriptional profile using k-means clustering. Note that this clustering has been performed after correcting for total transcriptional activity per nucleus (Figure S4). The percent of genes belonging to each cluster are displayed next to the cluster. (B) H2A.Z, H3K9ac and H3K4me3 profiles were plotted through development for 3 clusters of genes (from Fig. 4A, indicated by arrows) with maximum transcriptional activity at the beginning (top), in the middle (middle) or at the end (bottom) of the intraerythrocytic cycle. Y-axis was scaled to maximal occupancy. Solid lines represent average H2A.Z, H3K9ac or H3K4me3 profiles for each cluster, grey lines represent individual genes.

References

    1. Lasonder E, Ishihama Y, Andersen JS, Vermunt AM, Pain A, et al. Analysis of the Plasmodium falciparum proteome by high-accuracy mass spectrometry. Nature. 2002;419:537–542. - PubMed
    1. Bozdech Z, Llinas M, Pulliam BL, Wong ED, Zhu J, et al. The transcriptome of the intraerythrocytic developmental cycle of Plasmodium falciparum. PLoS Biol. 2003;1:E5. - PMC - PubMed
    1. Le Roch KG, Zhou Y, Blair PL, Grainger M, Moch JK, et al. Discovery of gene function by expression profiling of the malaria parasite life cycle. Science. 2003;301:1503–1508. - PubMed
    1. Otto TD, Wilinski D, Assefa S, Keane TM, Sarry LR, et al. New insights into the blood-stage transcriptome of Plasmodium falciparum using RNA-Seq. Mol Microbiol. 2010;76:12–24. - PMC - PubMed
    1. Sims JS, Militello KT, Sims PA, Patel VP, Kasper JM, et al. Patterns of gene-specific and total transcriptional activity during the Plasmodium falciparum intraerythrocytic developmental cycle. Eukaryot Cell. 2009;8:327–338. - PMC - PubMed

Publication types