. 2010 Dec 16;6(12):e1001230.
doi: 10.1371/journal.ppat.1001230.

Mycobacterium tuberculosis eis regulates autophagy, inflammation, and cell death through redox-dependent signaling

Affiliations

Mycobacterium tuberculosis eis regulates autophagy, inflammation, and cell death through redox-dependent signaling

Dong-Min Shin et al. PLoS Pathog. .

Abstract

The "enhanced intracellular survival" (eis) gene of Mycobacterium tuberculosis (Mtb) is involved in the intracellular survival of M. smegmatis. However, its exact effects on host cell function remain elusive. We herein report that Mtb Eis plays essential roles in modulating macrophage autophagy, inflammatory responses, and cell death via a reactive oxygen species (ROS)-dependent pathway. Macrophages infected with an Mtb eis-deletion mutant H37Rv (Mtb-Δeis) displayed markedly increased accumulation of massive autophagic vacuoles and formation of autophagosomes in vitro and in vivo. Infection of macrophages with Mtb-Δeis increased the production of tumor necrosis factor-α and interleukin-6 over the levels produced by infection with wild-type or complemented strains. Elevated ROS generation in macrophages infected with Mtb-Δeis (for which NADPH oxidase and mitochondria were largely responsible) rendered the cells highly sensitive to autophagy activation and cytokine production. Despite considerable activation of autophagy and proinflammatory responses, macrophages infected with Mtb-Δeis underwent caspase-independent cell death. This cell death was significantly inhibited by blockade of autophagy and c-Jun N-terminal kinase-ROS signaling, suggesting that excessive autophagy and oxidative stress are detrimental to cell survival. Finally, artificial over-expression of Eis or pretreatment with recombinant Eis abrogated production of both ROS and proinflammatory cytokines, which depends on the N-acetyltransferase domain of the Eis protein. Collectively, these data indicate that Mtb Eis suppresses host innate immune defenses by modulating autophagy, inflammation, and cell death in a redox-dependent manner.


Conflict of interest statement

The authors have declared that no competing interests exist.

Figures

Figure 1
Figure 1. Mtb Eis modulates autophagy in macrophages.
(A) BMDMs were infected with Mtb-WT, Mtb-Δeis, or Mtb-c-eis (MOI = 10) for 4 h (as described in the Materials and Methods), and then incubated for 24 h (left) or the indicated periods of time (right). Cells were fixed, stained with DAPI to visualize nuclei (blue), and immunolabeled with an anti-LC3 antibody. Primary antibody was detected using an Alexa Fluor 488-conjugated goat anti-rabbit IgG (green). Left: representative immunofluorescence images of LC3 punctae; right: quantification of data (LC3-punctated cells were counted manually). ***p<0.001, vs. Mtb-WT-infected condition. Scale bars, 5 µm. (B) BMDMs were infected with Mtb-Δeis in the absence or presence of 3-methyladenine (3-MA; 10 mM) and subjected to confocal analysis as described in Figure 1A. LC3-punctated cells were counted manually. Each condition was assayed in triplicate, and at least 250 cells were counted in each well. ***p<0.001, vs. SC. (C) Immunoblot analyses performed using Abs raised to LC3 or β-actin. Experimental conditions were identical to those outlined in panel A. Gel images representative of three experiments are shown. (D) Electron micrographs of Mtb-Δeis-infected BMDMs under low (left) and high (right) magnification show the accumulation of autophagic vesicles (black arrow, initial autophagic vacuoles; white arrow, degradative autophagic vacuoles). Scale bars: 2 µm (left), 0.5 µm (right). (E) Immunoblot analyses performed using Abs raised to LC3 or β-actin. BMDMs were infected with Mtb-Δeis in the presence or absence of 3-MA (10 mM) or bafilomycin A1 (Baf-A1; 100 nM). Gel images representative of three experiments are shown. The ratio of the intensities of the LC3-II/LC3-I and β-actin bands is indicated below each lane (C and E). UI, uninfected; SC, solvent control (0.1% distilled water (B), 0.1% DMSO (E)).
Figure 2
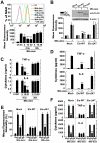
Figure 2. Mtb-Δeis infection increases production of proinflammatory cytokines and ROS by BMDMs.
(A and B) BMDMs were infected with Mtb-WT, Mtb-Δeis or Mtb-c-eis at different MOIs (0.1, 1 and 10) for 18 h (A) or for the indicated periods of time (B; MOI = 10). Supernatants were assessed by ELISA for levels of TNF-α and IL-6. Data (A and B) are presented as the mean±SD of five experiments. (C and D) BMDMs were stimulated with Mtb-WT, Mtb-Δeis, or Mtb-c-eis for 30 min. Cells were then incubated with 10 µM DHE or 5 µM DCFH-DA for 15 min, washed thoroughly, and immediately analyzed for superoxide or H2O2 production by flow cytometry (C, Left). Cells were labeled with MitoSOX for 30 min and analyzed for mitochondrial ROS levels by flow cytometry (D, top). Quantitative analysis of ROS generation (C, right; D, bottom). *p<0.05, **p<0.01, ***p<0.001, vs. Mtb-WT-infected condition. UI, uninfected.
Figure 3
Figure 3. Increased ROS generation plays a critical role in autophagy and proinflammatory cytokine production in Mtb-Δeis-infected macrophages.
(A–C) BMDMs were infected with Mtb-Δeis (MOI = 10) for 18 h in the presence or absence of DPI (10 µM), NAC (20 mM), catalase (Cat, 1 mU/mL), or tiron (5 mM). (A) Representative immunofluorescence images (top); percentage of endogenous LC3-punctated cells (bottom). (B) Immunoblot analyses of BMDMs with antibodies raised to LC3 or β-actin. Gel images are representative of three experiments. The ratio of the intensities of the LC3-II/LC3-I and β-actin bands is indicated below each lane. (C) Experimental conditions were identical to those outlined in Figure 3A. Supernatants collected 18 h after infection were assessed for cytokine levels by ELISA. Data represent the mean±SD of five experiments. (D–F) BMDMs from WT and NOX2 KO mice were infected with Mtb-WT, Mtb-Δeis, or Mtb-c-eis for 18 h. (D) Numbers of LC3-punctated cells (counted manually) are shown (at least 250 cells were counted in each well). (E) Immunoblot analyses performed using Abs raised to LC3 or β-actin. BMDMs from WT and NOX2 KO mice were infected with Mtb-Δeis for 18 h. Gel images representative of three experiments are shown. (F) Supernatants collected 18 h after infection were assessed for cytokine levels by ELISA. Data are presented as the mean±SD of at least three separate experiments, each performed in triplicate. ***p<0.001, vs. SC (A and C); WT mice (D and F). UI, uninfected; SC, solvent control (0.1% DMSO).
Figure 4
Figure 4. Macrophages infected with Mtb-Δeis show reduced cell viability and increased caspase-independent cell death.
(A) BMDMs were infected with Mtb-WT, Mtb-Δeis, or Mtb-c-eis (MOI = 10) for the indicated periods of time, washed to remove unbound mycobacteria, and then incubated in complete DMEM at 37°C in 5% CO2. Cell viability was assessed by PI staining and then examined by fluorescence microscopy. (B and C) Experimental conditions were identical to those outlined in panel A. BMDMs were infected with the three strains of mycobacteria for 36 h. (B) Apoptosis was assessed using a TUNEL/apoptosis detection kit, according to the manufacturer's protocol. Cells were then examined under a laser-scanning confocal microscope (LSM 510; Zeiss). Percentages of TUNEL-positive, PI-positive, and TUNEL-/PI-double-positive cells were calculated. Data are representative of three separate experiments. (C) Morphological changes in BMDMs infected with Mtb-WT, Mtb-Δeis, or Mtb-c-eis at MOIs of 1 and 10. Representative images are shown. Scale bars: 50 µm (low magnification), 20 µm (high magnification). (D) Macrophages were infected with Mtb-WT, Mtb-Δeis, or Mtb-c-eis in the presence or absence of zVAD-fmk (20 µM) or 3-MA (10 mM). Staurosporine (STS; 500 nM) was used as a positive control. After 36 h, cells were stained with PI and then examined by fluorescence microscopy. Data are presented as the mean±SD of at least three separate experiments, each performed in duplicate. *p<0.05, ***p<0.001, vs. Mtb-WT-infected condition (A and B); Mtb-Δeis–infected condition without inhibitors (D). UI, uninfected.
Figure 5
Figure 5. Infection with Mtb-Δeis induces cell death through JNK-dependent signaling.
(A and B) BMDMs were infected with Mtb-WT, Mtb-Δeis, or Mtb-c-eis (MOI = 1) for the indicated periods of time, and then subjected to Western blot analysis using Abs raised to p-ERK1/2, p-p38, p-JNK, and β-actin. Data shown are representative of three independent experiments that all yielded similar results (A). Expression of phospho-MAPK/β-actin protein in cytoplasmic extracts of BMDMs was quantified densitometrically (B). (C and D) BMDMs were pretreated with U0126 (5, 10, 20 µM), SB203580 (SB; 1, 5, 10 µM), or SP600125 (SP; 5, 10, 20 µM) for 45 min, and then infected with Mtb-Δeis for 30 min (C) or 36 h (D). (C) Cells were then incubated with DHE for 15 min, washed rapidly and thoroughly, and analyzed immediately for superoxide levels by flow cytometry. Quantitative DHE fluorescence data represent the mean±SD of four experiments. (D) Cell death after 36 h was assessed by PI staining and then examined by fluorescence microscopy. (E) Raw264.7 cells were transfected with siRNA specific for JNK1 (siJNK) or a non-specific control siRNA (siNS). At 24 h after transfection, cells were infected with Mtb-Δeis for 36 h. Cell death was then assessed by PI staining, and then examined by flow cytometry. Transfection efficiency was assessed by RT-PCR (inset). Data represent the mean±SD of five random fields and are representative of three independent experiments (D and E). *p<0.05, **p<0.01, ***p<0.001, vs. Mtb-WT-infected condition (B); SC (C and D); siNS (E). UI, uninfected; SC, solvent control (0.1% DMSO).
Figure 6
Figure 6. In vivo analysis of autophagic vesicles, inflammation, and cell death in infected mice with Mtb-Δeis.
C57BL/6 mice were challenged, by aerosol, with 10–30 CFU Mtb-WT, Mtb-Δeis, or Mtb-c-eis and sacrificed 4 weeks post-infection. (A) High- and low-magnification electron micrographs of lung tissue sections from mice infected with Mtb-Δeis show accumulation of autophagic vesicles (black arrow, bacteria in autophagic vacuoles; white arrow, degradative autophagic vacuoles). Scale bars: 2 µm (left upper), 0.5 µm (right). Numbers of autophagic vacuoles per cell in each TEM section (left lower) (mean±SD; n = 50). (B) Quantitative RT-PCR analysis of lung tissue from Mtb-WT-, Mtb-Δeis-, and Mtb-c-eis-infected mice. Total RNA was extracted from paraffin-embedded lung tissue sections, as described in the Materials and Methods. (C) To assess in vivo cell death, bronchoalveolar lavage fluid cells from Mtb-WT-, Mtb-Δeis-, and Mtb-c-eis-infected mice were subjected to PI staining, and analyzed by flow cytometry. Data are presented as the mean±SEM (n = 4). (D) Numbers of CFUs in lung and spleen 4 weeks after infection with Mtb-WT, Mtb-Δeis, or Mtb-c-eis. Data are presented as log10 CFU±SEM (n = 4). (E) BMDMs were infected with Mtb-WT, Mtb-Δeis, or Mtb-c-eis and then analyzed by CFU assay. CFU data represent the mean±SD of four individual experiments. **p<0.01, ***p<0.001, vs. Mtb-WT-infected condition. UI, uninfected.
Figure 7
Figure 7. Eis modulates ROS release and proinflammatory cytokine production through its N-acetyltransferase domain.
(A) Intracellular superoxide production was analyzed by flow cytometric analysis. BMDMs were infected with Mtb-Δeis (MOI = 10) in the presence or absence of recombinant Eis protein (rEis; 5, 10, 20 µg/mL) or 30 kDa Mtb antigen (30 k; 5, 10, 20 µg/mL). Upper, representative flow cytometric analysis; lower, quantitation of superoxide generation. (B) THP-1 cells were transfected with mock, Eis-WT, or Eis-ΔAT constructs, and infected with Mtb-Δeis for 30 min. Cells were stained with DHE (for superoxide) or DCFH-DA (for H2O2) and subjected to flow cytometric analysis. Inset, transfection efficiency. (C and D) Experimental conditions were identical to those outlined in panels A and B, respectively. Supernatants were collected 18 h after infection and assessed by ELISA for levels of TNF-α and IL-6. Data are presented as the mean±SD of five experiments. (E and F) THP-1 cells transfected with mock, Eis-WT, or Eis-ΔAT constructs were pretreated with SP600125 (SP; 20 µM) or SB203580 (SB; 5 µM) for 45 min before infection with Mtb-Δeis for 30 min (E) or 18 h (F). E, Intracellular superoxide production was analyzed by flow cytometric analysis. F, ELISA analysis for TNF-α and IL-6 levels. Data are presented as the mean±SD of three experiments. **p<0.01, ***p<0.001, vs. SC (A, C, E, and F); mock control (B and D). UI, uninfected; SC, solvent control (0.1% DMSO).

References

    1. Pieters J. Mycobacterium tuberculosis and the macrophage: maintaining a balance. Cell Host Microbe. 2008;3:399–407. - PubMed
    1. Houben EN, Nguyen L, Pieters J. Interaction of pathogenic mycobacteria with the host immune system. Curr Opin Microbiol. 2006;9:76–85. - PubMed
    1. Deretic V, Fratti RA. Mycobacterium tuberculosis phagosome. Mol Microbiol. 1999;31:1603–1609. - PubMed
    1. Hirayama Y, Yoshimura M, Ozeki Y, Sugawara I, Udagawa T, et al. Mycobacteria exploit host hyaluronan for efficient extracellular replication. PLoS Pathog. 2009;5:e1000643. - PMC - PubMed
    1. Deretic V, Levine B. Autophagy immunity and microbial adaptations. Cell Host Microbe. 2009;5:527–549. - PMC - PubMed

Publication types