. 2010 Dec 16;6(12):e1001022.
doi: 10.1371/journal.pcbi.1001022.

The evolutionary analysis of emerging low frequency HIV-1 CXCR4 using variants through time--an ultra-deep approach

Affiliations

The evolutionary analysis of emerging low frequency HIV-1 CXCR4 using variants through time--an ultra-deep approach

John Archer et al. PLoS Comput Biol. .

Abstract

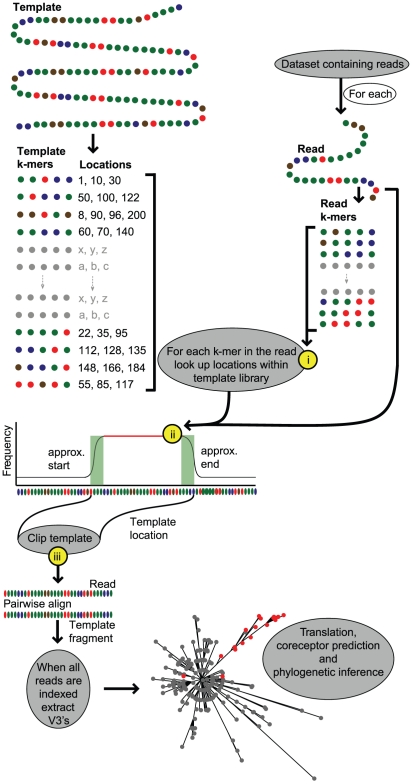
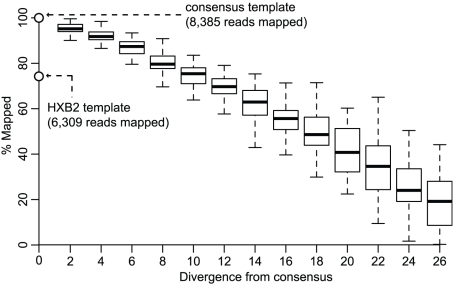
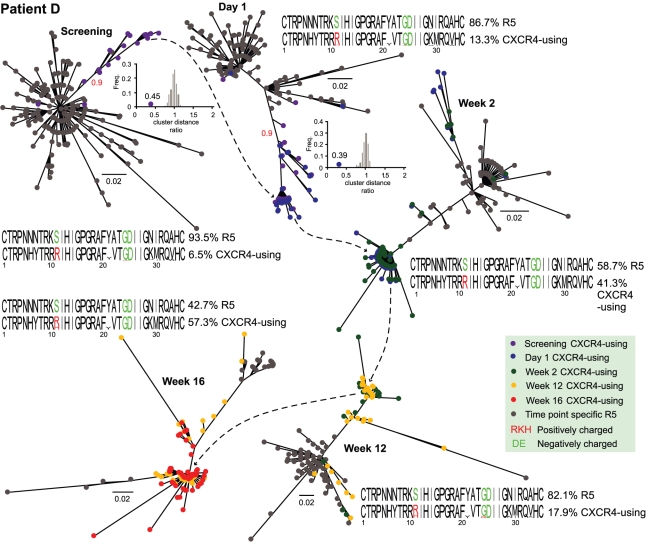
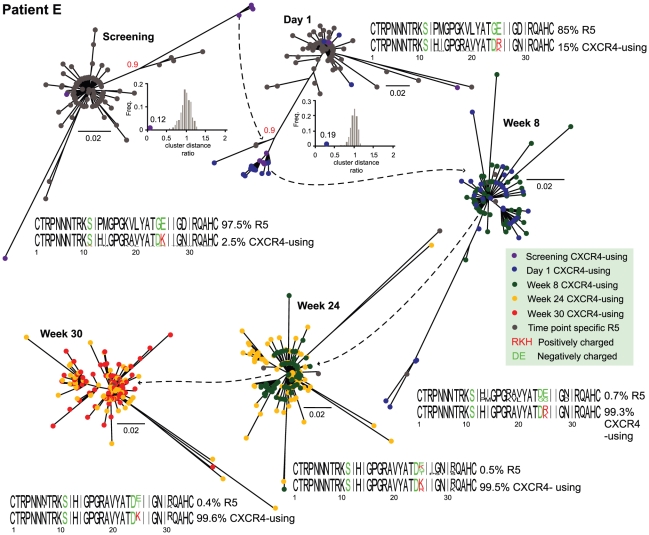
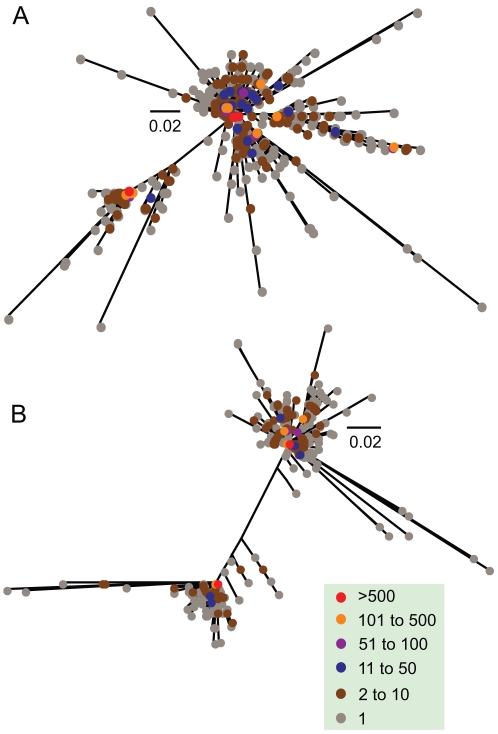
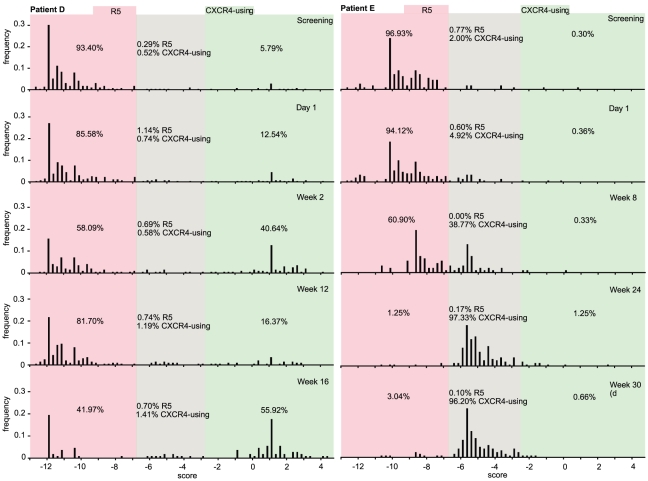
Large-scale parallel pyrosequencing produces unprecedented quantities of sequence data. However, when generated from viral populations current mapping software is inadequate for dealing with the high levels of variation present, resulting in the potential for biased data loss. In order to apply the 454 Life Sciences' pyrosequencing system to the study of viral populations, we have developed software for the processing of highly variable sequence data. Here we demonstrate our software by analyzing two temporally sampled HIV-1 intra-patient datasets from a clinical study of maraviroc. This drug binds the CCR5 coreceptor, thus preventing HIV-1 infection of the cell. The objective is to determine viral tropism (CCR5 versus CXCR4 usage) and track the evolution of minority CXCR4-using variants that may limit the response to a maraviroc-containing treatment regimen. Five time points (two prior to treatment) were available from each patient. We first quantify the effects of divergence on initial read k-mer mapping and demonstrate the importance of utilizing population-specific template sequences in relation to the analysis of next-generation sequence data. Then, in conjunction with coreceptor prediction algorithms that infer HIV tropism, our software was used to quantify the viral population structure pre- and post-treatment. In both cases, low frequency CXCR4-using variants (2.5-15%) were detected prior to treatment. Following phylogenetic inference, these variants were observed to exist as distinct lineages that were maintained through time. Our analysis, thus confirms the role of pre-existing CXCR4-using virus in the emergence of maraviroc-insensitive HIV. The software will have utility for the study of intra-host viral diversity and evolution of other fast evolving viruses, and is available from http://www.bioinf.manchester.ac.uk/segminator/.


Conflict of interest statement

The authors have declared that no competing interests exist.

Figures

Figure 1
Figure 1. The data analysis framework.
On the left hand side the preprocessing of the template sequence prior to read mapping is illustrated. The fragments titled “k-mers” are all the unique words (length = 5) within the template sequence. These are stored along with their corresponding locations. On the opposite side all k-mers of equal length, extracted from the read, are shown. The plot indicates the frequency of k-mer matches across the template sequence for a single read. Grey boxes indicate processing events that take place within the framework. The yellow circles indicate optimization steps: (i) only exact k-mer matches used (ii) a heuristic alignment not constructed from the k-mer matching (just the k-mer match frequencies are plotted) and (iii) only the appropriate region of the template is pairwise aligned to the read.
Figure 2
Figure 2. Relationship between k-mer mapping and diversity.
As divergence from the consensus template increases the number of reads successfully mapped decreases. Each box and whisker (1.5 times the inter-quartile range) represents 50 repetitions of the mapping process at the level of divergence indicated on the x-axis. The bottom circle, on the y-axis, indicates the percentage of reads mapped to HXB2 in relation to the total number mapped to the consensus template (top circle). The dataset used for this comparison was patient D at screening.
Figure 3
Figure 3. Evolutionary relationships of patient D's viral population through time.
Each phylogeny shows the predicted R5 and CXCR4-using variants for the time points: screening, day 1, week 2, week 12 and week 16; only unique variants are shown. Subsequent to screening, the CXCR4-using variants from the previous time point are included for visualization purposes. Sequence logos for R5 and CXCR4-using sequences for each time point are also shown. Colors (see key) indicate sampling time in phylogenies and residue charges in sequence logos. The red numbers on the lineage separating branches at screening and day 1 indicate the branch support value from the approximate likelihood ratio test for the distinct CXCR4-using lineage present at these time points. The inset plots indicate the extent of the clustering present for these same lineages and time points (value next to circle on x axis) in comparison to a distribution of randomly assigned clusters; see methods for further details. The scale bar represents nucleotide substitutions per site.
Figure 4
Figure 4. Evolutionary relationships of patient E's viral population through time.
Each phylogeny shows the predicted R5 and CXCR4-using variants for the time points: screening, day 1, week 8, week 24 and week 30. See figure 3's legend for further details.
Figure 5
Figure 5. Frequency of HIV-1 variants in the phylogenetic trees.
Evolutionary tree inferred from all patient D's V3 nucleotide sequences (A), and all patient E's V3 nucleotide sequences (B). Colors (see key) indicate the frequency of each sequence. The scale bar represents nucleotide substitutions per site.
Figure 6
Figure 6. Tropism prediction.
Frequency plots of PSSM scores of unique V3 sequences within each dataset. The red area indicates the region below the −6.96 threshold (R5), the green region indicates the area above the −2.88 threshold (CXCR4-using) and the grey area indicates the region between the two thresholds. The numbers within each plot area indicate the percentage of reads called as R5 or CXCR4-using for that region.

Similar articles

Cited by

References

    1. Margulies M, Egholm M, Altman WE, Attiya S, Bader JS, et al. Genome sequencing in microfabricated high-density picolitre reactors. Nature. 2005;437:376–380. - PMC - PubMed
    1. Brockman W, Alvarez P, Young S, Garber M, Giannoukos G, et al. Quality scores and SNP detection in sequencing-by-synthesis systems. Genome Res. 2008;18:763–770. - PMC - PubMed
    1. Wang C, Mitsuya Y, Gharizadeh B, Ronaghi M, Shafer RW. Characterization of mutation spectra with ultra-deep pyrosequencing: application to HIV-1 drug resistance. Genome Res. 2007;17:1195–1201. - PMC - PubMed
    1. Pop M, Salzberg SL. Bioinformatics challenges of new sequencing technology. Trends Genet. 2008;24:142–149. - PMC - PubMed
    1. Shendure J, Hanlee J. Next-generation DNA sequencing. Nat Biotech. 2008;26:1135–1145. - PubMed

Publication types

MeSH terms