. 2010 Dec 20;5(12):e15710.
doi: 10.1371/journal.pone.0015710.

Multiplexed echo planar imaging for sub-second whole brain FMRI and fast diffusion imaging

Affiliations

Multiplexed echo planar imaging for sub-second whole brain FMRI and fast diffusion imaging

David A Feinberg et al. PLoS One. .

Erratum in

  • PLoS One. 2011;6(9). doi: 10.1371/annotation/d9496d01-8c5d-4d24-8287-94449ada5064. Gunther, Matthias [added]

Abstract

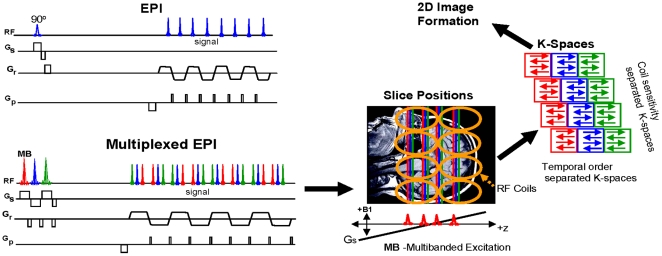
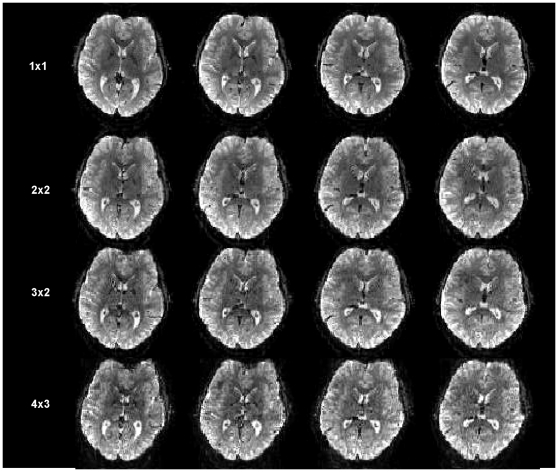
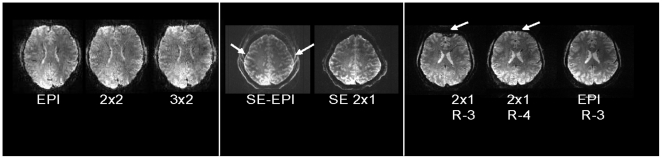
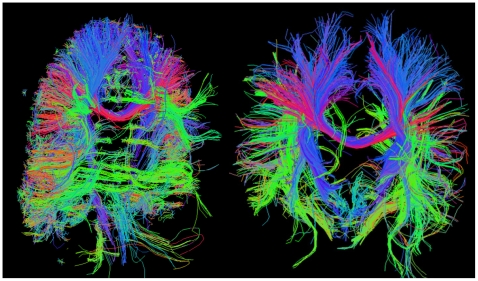
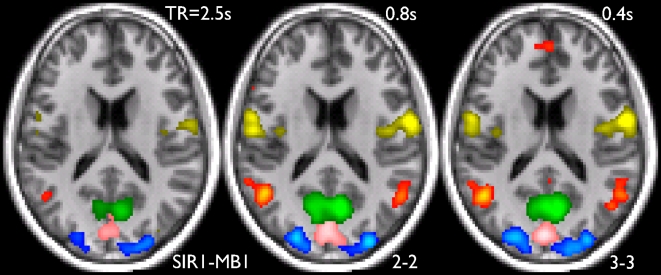
Echo planar imaging (EPI) is an MRI technique of particular value to neuroscience, with its use for virtually all functional MRI (fMRI) and diffusion imaging of fiber connections in the human brain. EPI generates a single 2D image in a fraction of a second; however, it requires 2-3 seconds to acquire multi-slice whole brain coverage for fMRI and even longer for diffusion imaging. Here we report on a large reduction in EPI whole brain scan time at 3 and 7 Tesla, without significantly sacrificing spatial resolution, and while gaining functional sensitivity. The multiplexed-EPI (M-EPI) pulse sequence combines two forms of multiplexing: temporal multiplexing (m) utilizing simultaneous echo refocused (SIR) EPI and spatial multiplexing (n) with multibanded RF pulses (MB) to achieve m×n images in an EPI echo train instead of the normal single image. This resulted in an unprecedented reduction in EPI scan time for whole brain fMRI performed at 3 Tesla, permitting TRs of 400 ms and 800 ms compared to a more conventional 2.5 sec TR, and 2-4 times reductions in scan time for HARDI imaging of neuronal fibertracks. The simultaneous SE refocusing of SIR imaging at 7 Tesla advantageously reduced SAR by using fewer RF refocusing pulses and by shifting fat signal out of the image plane so that fat suppression pulses were not required. In preliminary studies of resting state functional networks identified through independent component analysis, the 6-fold higher sampling rate increased the peak functional sensitivity by 60%. The novel M-EPI pulse sequence resulted in a significantly increased temporal resolution for whole brain fMRI, and as such, this new methodology can be used for studying non-stationarity in networks and generally for expanding and enriching the functional information.


Conflict of interest statement

Competing Interests: Authors of this work, David Feinberg and Sudhir Ramanna, are employees of Advanced MRI Technologies, which is engaged in the development of magnetic resonance imaging pulse sequences. Some of the innovation and design of the pulse sequence presented in this work was done by Advanced MRI Technologies. This work was jointly developed with researchers at the University of Minnesota and Oxford University. However, this does not alter the authors' adherence to all the PLoS ONE policies on sharing data and materials, as detailed online in the guide for authors.

Figures

Figure 1
Figure 1. Description of the M-EPI pulse sequence compared with conventional EPI.
Top) EPI pulse sequence generates a single image during each readout which is repeated by the number of slices to scan the whole brain. Bottom) Multiplexed-EPI (M-EPI) pulse sequence generates several images during a single echo train readout and thus requires fewer repeats to scan the whole brain. The multibanded (MB) RF excitation pulses are the sum of n frequency offset sinc-modulated pulses which excite slices at widely spaced positions to improve the separation of signal from the different receiver coils. (Slice Positions) show closely spaced SIR images (red, blue, green) and the excitation positions of the n sinc pulses of the first MB pulse. The MB pulse is repeated m times for SIR excitations and corresponding signals (red, blue, green) are separated (K-Spaces) into individual k-spaces according to their temporal order in the signal readout period. The MB signals (same color) are further separated into k-spaces using the differential coil sensitivity. 2D FT image reconstruction of each individual k-space data set gives m×n number of M-EPI images.
Figure 2
Figure 2. Images at 3 Tesla, comparing 4 adjacent slices out of the total 60 slices at 2mm isotropic resolution covering the entire brain.
Each row of images was obtained with a different pulse sequence and slice acceleration, producing 1, 4, 6 and 12 slices from the EPI echo train. The mxn parameters (SIR× MB) are shown.
Figure 3
Figure 3. M-EPI images acquired at 7 Tesla.
left) M-EPI with 1.5 mm isotropic resolution comparing 1, 4 and 6 images per echo train utilizing different multiplexing. middle) SE EPI has chemical shift artifact (arrows) that is normally removed with fat-saturation RF pulses or using different pulse lengths for the excitation and the refocusing pulse; the SE M-EPI images have inherent absence of the fat ghost artifact and require half as many refocusing pulses to substantially reduce SAR. right) By increasing parallel imaging from R-3 to R-4, the echo train shortened to overcome SIR lengthening to remove the artifact (arrow) with similar appearance to EPI with R-3 and similar echo train length.
Figure 4
Figure 4. Neuronal Fiber tracks generated using the M-EPI sequence.
Two projections of the 3D diffusion spectrum image (DSI) reveal large scale neuronal connections in major white matter pathways. 3T Diffusion acquisition parameters: DSI using b-maximum of 4500 s/mm2 and 256 b-value encodings; Imaging parameters: SIR2 × MB2, 3 mm resolution, total acquisition time 8.5 min., TR/2000 ms and signal bandwidth 2604 Hz/pixel.
Figure 5
Figure 5. Five example RSNs (resting state networks) from the 3 different 10-minute resting FMRI acquisitions, from subject 2.
The color overlays are z-statistic images, thresholded at Z = 4 in all cases. In this central axial slice (Z = +18 mm in MNI152 standard space) the RSNs shown cover visual areas, the default mode network and a sensori-motor network.
Figure 6
Figure 6. Boxplots over all RSNs (excluding the artefactual ICA components) and over all 3 subjects, quantifying various image statistics.
The top row in each sub-figure shows a separate boxplot for each of the three TRs, and the bottom row shows the ratio of the 0.8 s and 0.4 s values to the 2.5 s values, the ratio being calculated separately for each RSN (and each subject) before feeding into the boxplot. Fig. 6a shows the results from a 100-dimensional ICA decomposition across all 3 TRs (separately for each subject) and Fig. 6b shows the results from a 10-dimensional regression of previously published large-scale RSNs from a separate study. For each regression type (multiple or single) and for each RSN map, we have a ‘mixture-model-corrected’ Z-stat image (see Methods). The two main measures we take from that Z-stat image are the peak value and the sum of all Z-stat values over a threshold. For the voxel having the peak Z-stat, we also report the parameter estimate (‘PE’, or RSN amplitude, shown as a % signal change) and the size of the regression residuals. Finally we also show the ratio of these two measures, which contains similar information to the Z-stat (i.e., CNR), but without taking into account the temporal DOF.

References

    1. Kwong KK, Belliveau JW, Chesler DA, Goldberg IE, Weisskoff RM, et al. Dynamic magnetic resonance imaging of human brain activity during primary sensory stimulation. Proc Natl Acad Sci USA. 1992;89:5675–5679. - PMC - PubMed
    1. Ogawa S, Tank DW, Menon R, Ellermann JM, Kim S-G, et al. Intrinsic signal changes accompanying sensory stimulation: Functional brain mapping with magnetic resonance imaging. Proc Natl Acad Sci USA. 1992;89:5951–5955. - PMC - PubMed
    1. Moseley ME, Cohen Y, Kucharczyk J, Mintorovitch J, Asgari HS, et al. Diffusion-weighted MR imaging of anisotropic water diffusion in cat central nervous system. Radiology. 1990;176:439–445. - PubMed
    1. Mori S, Barker PB. Diffusion magnetic resonance imaging: its principle and applications. Anat Rec. 1999;257:102–109. - PubMed
    1. Mori S, Zhang J. Principles of diffusion tensor imaging and its applications to basic neuroscience research. Neuron. 2006;51:527–539. - PubMed

Publication types