. 2011 Jun;34(5):533-45.
doi: 10.1007/s00449-010-0502-y. Epub 2010 Dec 25.

Quantitative characterization of metabolism and metabolic shifts during growth of the new human cell line AGE1.HN using time resolved metabolic flux analysis

Affiliations

Quantitative characterization of metabolism and metabolic shifts during growth of the new human cell line AGE1.HN using time resolved metabolic flux analysis

Jens Niklas et al. Bioprocess Biosyst Eng. 2011 Jun.

Abstract

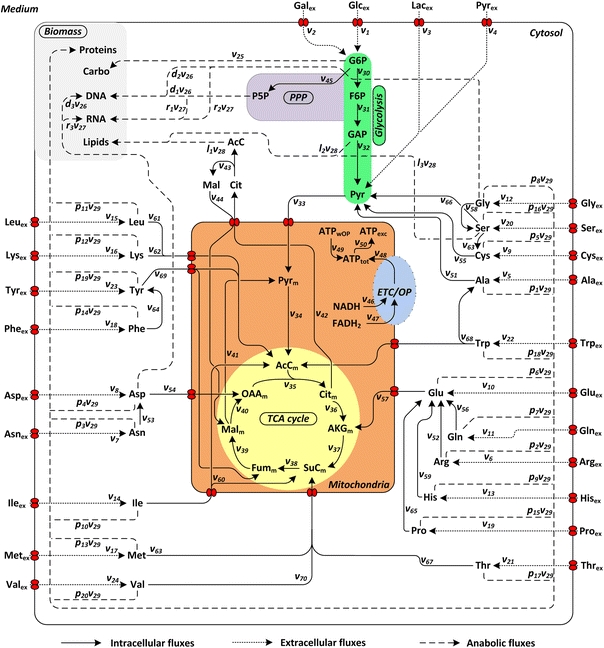
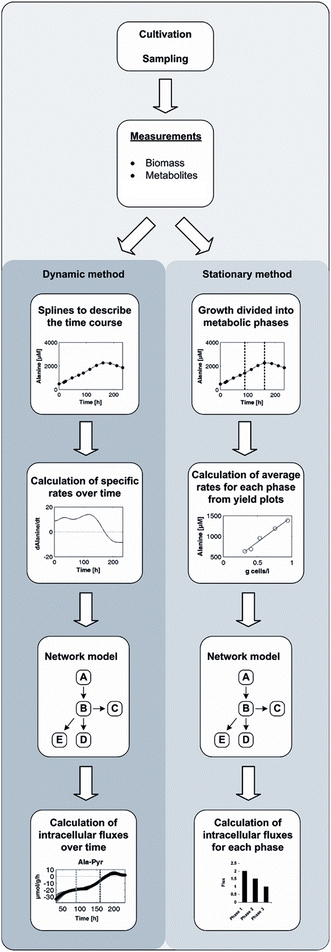
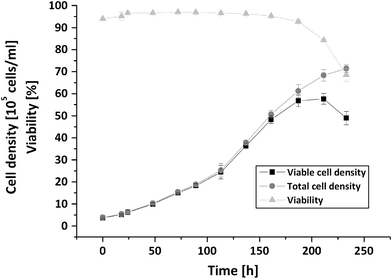
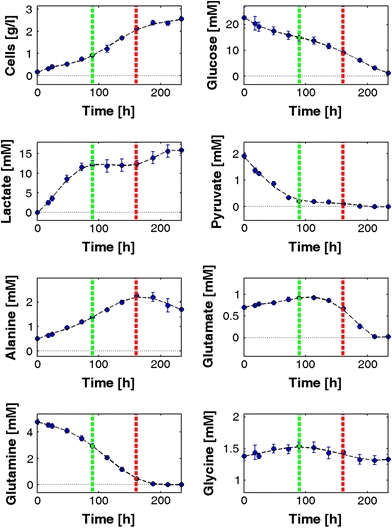
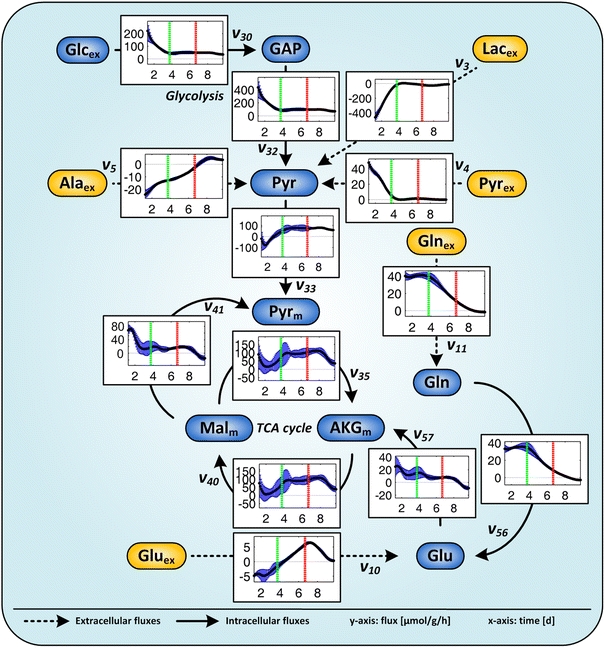
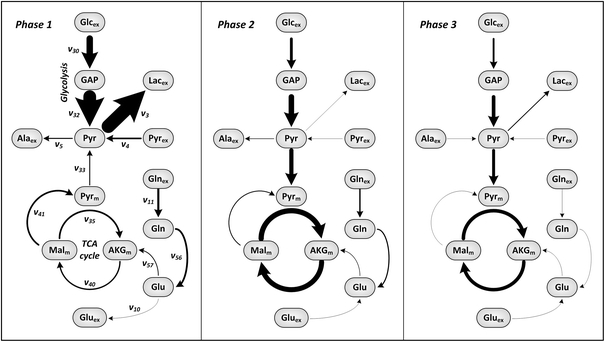
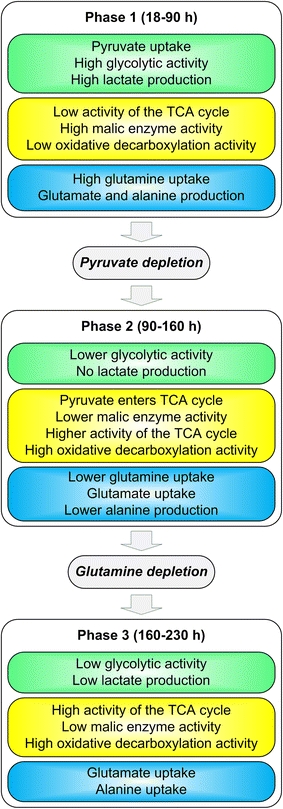
For the improved production of vaccines and therapeutic proteins, a detailed understanding of the metabolic dynamics during batch or fed-batch production is requested. To study the new human cell line AGE1.HN, a flexible metabolic flux analysis method was developed that is considering dynamic changes in growth and metabolism during cultivation. This method comprises analysis of formation of cellular components as well as conversion of major substrates and products, spline fitting of dynamic data and flux estimation using metabolite balancing. During batch cultivation of AGE1.HN three distinct phases were observed, an initial one with consumption of pyruvate and high glycolytic activity, a second characterized by a highly efficient metabolism with very little energy spilling waste production and a third with glutamine limitation and decreasing viability. Main events triggering changes in cellular metabolism were depletion of pyruvate and glutamine. Potential targets for the improvement identified from the analysis are (i) reduction of overflow metabolism in the beginning of cultivation, e.g. accomplished by reduction of pyruvate content in the medium and (ii) prolongation of phase 2 with its highly efficient energy metabolism applying e.g. specific feeding strategies. The method presented allows fast and reliable metabolic flux analysis during the development of producer cells and production processes from microtiter plate to large scale reactors with moderate analytical and computational effort. It seems well suited to guide media optimization and genetic engineering of producing cell lines.


Figures

Fig. 1
Fig. 1
Metabolic network used for metabolic flux analysis. PPP pentose phosphate pathway, TCA tricarboxylic acid; ETC electron transport chain, OP oxidative phosphorylation, Carbo carbohydrates, Glc glucose, Gal galactose, Lac lactate, Pyr pyruvate, G6P glucose 6-phosphate, P5P pentose 5-phosphate, F6P fructose 6-phosphate, GAP glyceraldehyde 3-phosphate, AcC acetyl coenzyme A, Cit citrate, AKG α-ketoglutarate, SuC succinyl coenzyme A, Fum fumarate, Mal malate, OAA oxaloacetate, ATP adenosine triphosphate, ATP OP ATP from oxidative phosphorylation, ATP wOP ATP without oxidative phosphorylation, ATP tot total ATP, ATP exc ATP excess, NADH nicotinamide adenine dinucleotide, FADH 2 flavin adenine dinucleotide, standard abbreviations for amino acids. Indices: m mitochondrial, ex extracellular
Fig. 2
Fig. 2
Methods applied for metabolic flux analysis. Dynamic method for calculation of the time course of metabolic fluxes and stationary method for calculation of mean fluxes for different metabolic phases
Fig. 3
Fig. 3
Growth of AGE1.HN. Viable cell density, total cell density and viability during batch cultivation. Mean values and standard deviations of four parallel cultivations
Fig. 4
Fig. 4
Cultivation profile of AGE1.HN. Mean values and standard deviations for cell mass and selected metabolites of four parallel cultivations are depicted. Further metabolites are depicted in Fig. S1 of the supplementary material. The first line (90 h) indicates the end of the first metabolic phase when pyruvate is depleted, the second line (160 h) the end of the second metabolic phase when glutamine is depleted
Fig. 5
Fig. 5
Selected metabolic fluxes of AGE1.HN over time related to biomass. Mean values and confidence intervals (90%) of four parallel cultivations. The fluxes (y-axis) are given in μmol g−1 h−1 and the time (x-axis) in days. The first line (90 h) indicates the end of the first metabolic phase when pyruvate is consumed, the second line (160 h) the end of the second metabolic phase when glutamine is consumed. Negative values indicate fluxes in the opposite direction of the arrow. Further extracellular and intracellular fluxes are depicted in Fig. S2 and Fig. S3 of the supplementary material
Fig. 6
Fig. 6
Average metabolic flux distribution of AGE1.HN in each metabolic phase. Flux symbols selected for this figure are shown in the flux map of phase 1 and are defined in the metabolic network (Fig. 1). Same experiment as shown in Fig. 5. Further data are provided in Table S3 of the supplementary material
Fig. 7
Fig. 7
Summary of metabolic shifts during batch cultivation of AGE1.HN

References

    1. O’Callaghan PM, James DC. Systems biotechnology of mammalian cell factories. Brief Funct Genomic Proteomic. 2008;7(2):95–110. doi: 10.1093/bfgp/eln012. - DOI - PubMed
    1. Ferrer-Miralles N, Domingo-Espin J, Corchero JL, Vazquez E, Villaverde A. Microbial factories for recombinant pharmaceuticals. Microb Cell Fact. 2009;8:17. doi: 10.1186/1475-2859-8-17. - DOI - PMC - PubMed
    1. Wurm FM. Production of recombinant protein therapeutics in cultivated mammalian cells. Nat Biotechnol. 2004;22(11):1393–1398. doi: 10.1038/nbt1026. - DOI - PubMed
    1. Pavlou AK, Reichert JM. Recombinant protein therapeutics—success rates, market trends, values to 2010. Nat Biotechnol. 2004;22(12):1513–1519. doi: 10.1038/nbt1204-1513. - DOI - PubMed
    1. Walsh G. Biopharmaceutical benchmarks 2006. Nat Biotechnol. 2006;24(7):769–776. doi: 10.1038/nbt0706-769. - DOI - PubMed

Publication types