

Exploring the use of internal and externalcontrols for assessing microarray technical performance
- PMID: 21189145
- PMCID: PMC3020182
- DOI: 10.1186/1756-0500-3-349
Exploring the use of internal and externalcontrols for assessing microarray technical performance
Abstract
Background: The maturing of gene expression microarray technology and interest in the use of microarray-based applications for clinical and diagnostic applications calls for quantitative measures of quality. This manuscript presents a retrospective study characterizing several approaches to assess technical performance of microarray data measured on the Affymetrix GeneChip platform, including whole-array metrics and information from a standard mixture of external spike-in and endogenous internal controls. Spike-in controls were found to carry the same information about technical performance as whole-array metrics and endogenous "housekeeping" genes. These results support the use of spike-in controls as general tools for performance assessment across time, experimenters and array batches, suggesting that they have potential for comparison of microarray data generated across species using different technologies.
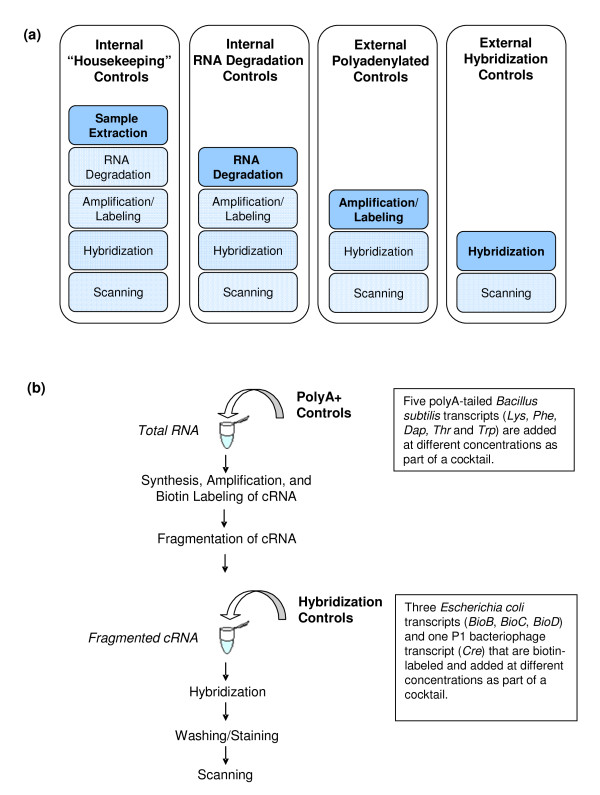
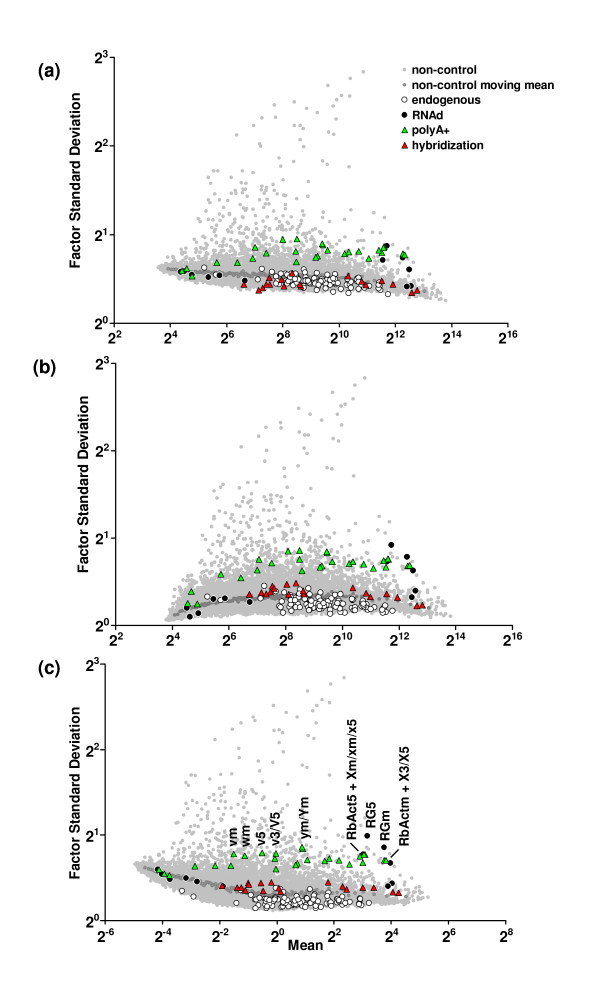
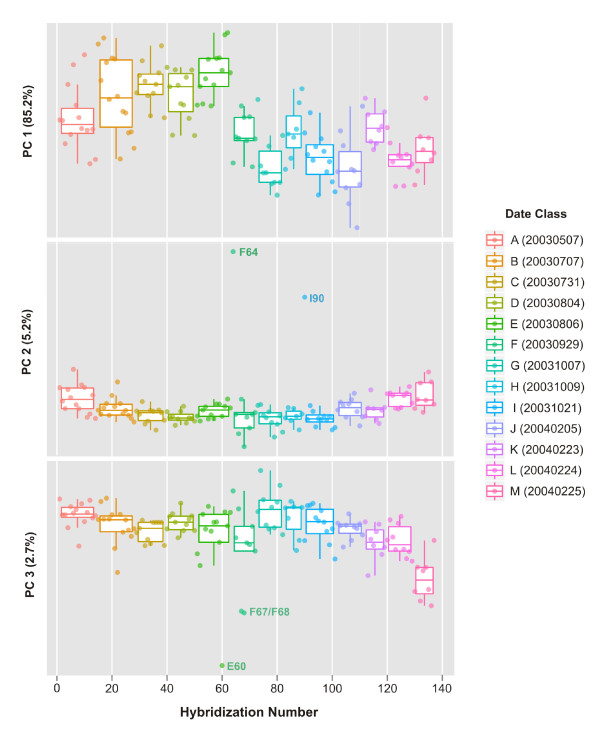
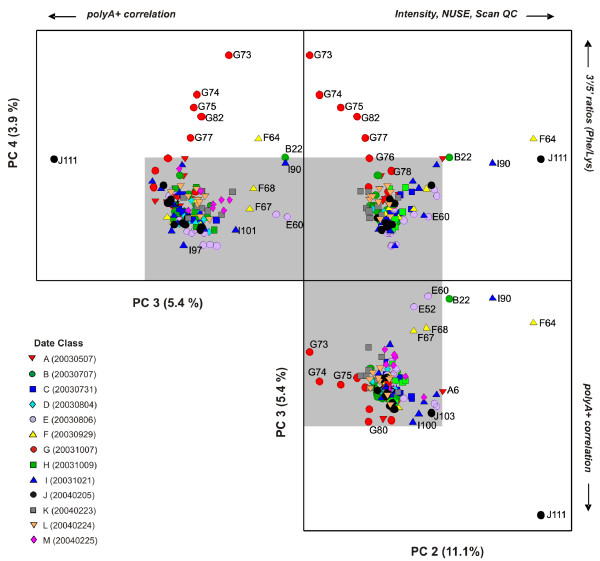
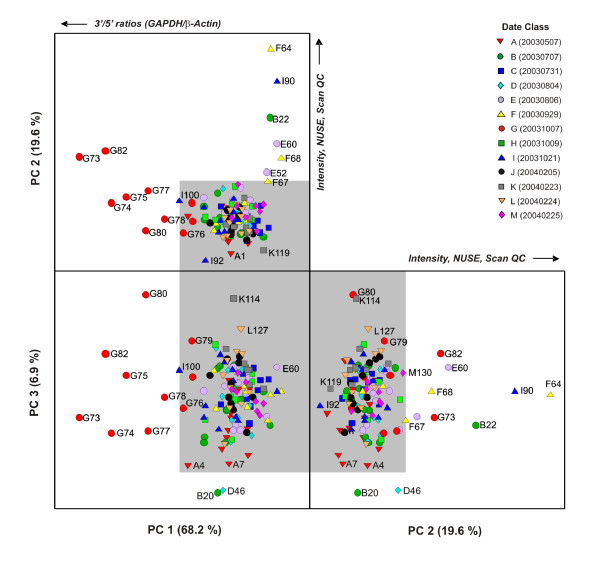
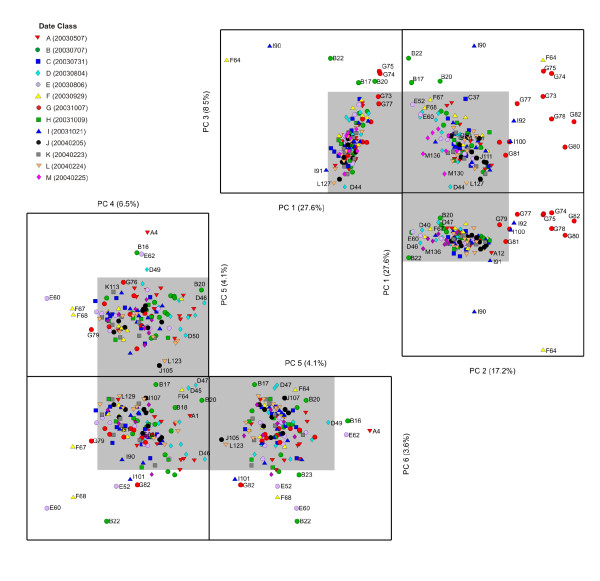
Results: A layered PCA modeling methodology that uses data from a number of classes of controls (spike-in hybridization, spike-in polyA+, internal RNA degradation, endogenous or "housekeeping genes") was used for the assessment of microarray data quality. The controls provide information on multiple stages of the experimental protocol (e.g., hybridization, RNA amplification). External spike-in, hybridization and RNA labeling controls provide information related to both assay and hybridization performance whereas internal endogenous controls provide quality information on the biological sample. We find that the variance of the data generated from the external and internal controls carries critical information about technical performance; the PCA dissection of this variance is consistent with whole-array quality assessment based on a number of quality assurance/quality control (QA/QC) metrics.
Conclusions: These results provide support for the use of both external and internal RNA control data to assess the technical quality of microarray experiments. The observed consistency amongst the information carried by internal and external controls and whole-array quality measures offers promise for rationally-designed control standards for routine performance monitoring of multiplexed measurement platforms.
Figures
Similar articles
-
Assessing affymetrix GeneChip microarray quality.BMC Bioinformatics. 2011 May 7;12:137. doi: 10.1186/1471-2105-12-137. BMC Bioinformatics. 2011. PMID: 21548974 Free PMC article.
-
Correlation analysis of external RNA controls reveals its utility for assessment of microarray assay.Anal Biochem. 2009 Feb 15;385(2):203-7. doi: 10.1016/j.ab.2008.11.019. Epub 2008 Dec 6. Anal Biochem. 2009. PMID: 19059192
-
Evaluation of the External RNA Controls Consortium (ERCC) reference material using a modified Latin square design.BMC Biotechnol. 2016 Jun 24;16(1):54. doi: 10.1186/s12896-016-0281-x. BMC Biotechnol. 2016. PMID: 27342544 Free PMC article.
-
Microarray data quality - review of current developments.OMICS. 2007 Spring;11(1):1-13. doi: 10.1089/omi.2006.0001. OMICS. 2007. PMID: 17411392 Review.
-
Use of external controls in microarray experiments.Methods Enzymol. 2006;411:50-63. doi: 10.1016/S0076-6879(06)11004-6. Methods Enzymol. 2006. PMID: 16939785 Review.
Cited by
-
Predictability of human differential gene expression.Proc Natl Acad Sci U S A. 2019 Mar 26;116(13):6491-6500. doi: 10.1073/pnas.1802973116. Epub 2019 Mar 7. Proc Natl Acad Sci U S A. 2019. PMID: 30846554 Free PMC article.
-
Using control genes to correct for unwanted variation in microarray data.Biostatistics. 2012 Jul;13(3):539-52. doi: 10.1093/biostatistics/kxr034. Epub 2011 Nov 17. Biostatistics. 2012. PMID: 22101192 Free PMC article.
-
Clinical implementation of RNA signatures for pharmacogenomic decision-making.Pharmgenomics Pers Med. 2011;4:95-107. doi: 10.2147/PGPM.S14888. Epub 2011 Sep 8. Pharmgenomics Pers Med. 2011. PMID: 23226056 Free PMC article.
-
Variation-preserving normalization unveils blind spots in gene expression profiling.Sci Rep. 2017 Mar 9;7:42460. doi: 10.1038/srep42460. Sci Rep. 2017. PMID: 28276435 Free PMC article.
References
-
- Shi LM, Reid LH, Jones WD, Shippy R, Warrington JA, Baker SC, Collins PJ, de Longueville F, Kawasaki ES, Lee KY. et al.The MicroArray Quality Control (MAQC) project shows inter- and intraplatform reproducibility of gene expression measurements. Nature Biotechnology. 2006;24:1151–1161. doi: 10.1038/nbt1239. - DOI - PMC - PubMed
LinkOut - more resources
Full Text Sources
Other Literature Sources
