. 2011 Mar;300(3):E536-42.
doi: 10.1152/ajpendo.00538.2010. Epub 2010 Dec 28.

In vivo activation of ROCK1 by insulin is impaired in skeletal muscle of humans with type 2 diabetes

Affiliations

In vivo activation of ROCK1 by insulin is impaired in skeletal muscle of humans with type 2 diabetes

Kwang-Hoon Chun et al. Am J Physiol Endocrinol Metab. 2011 Mar.

Abstract

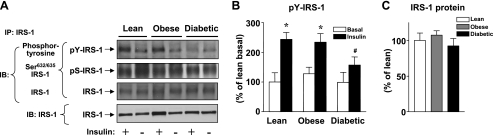
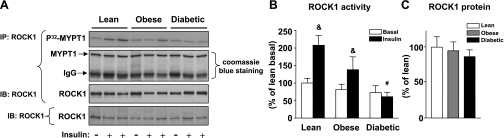
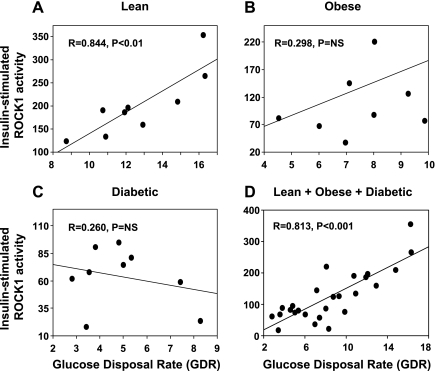
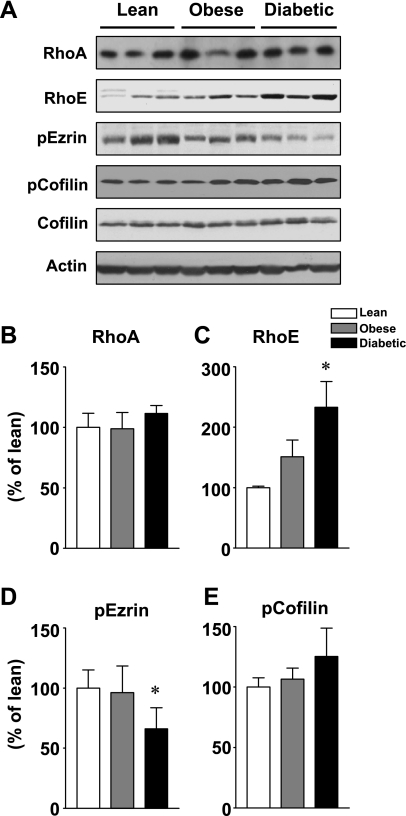
To determine whether serine/threonine ROCK1 is activated by insulin in vivo in humans and whether impaired activation of ROCK1 could play a role in the pathogenesis of insulin resistance, we measured the activity of ROCK1 and the protein content of the Rho family in vastus lateralis muscle of lean, obese nondiabetic, and obese type 2 diabetic subjects. Biopsies were taken after an overnight fast and after a 3-h hyperinsulinemic euglycemic clamp. Insulin-stimulated GDR was reduced 38% in obese nondiabetic subjects compared with lean, 62% in obese diabetic subjects compared with lean, and 39% in obese diabetic compared with obese nondiabetic subjects (all comparisons P < 0.001). Insulin-stimulated IRS-1 tyrosine phosphorylation is impaired 41-48% in diabetic subjects compared with lean or obese subjects. Basal activity of ROCK1 was similar in all groups. Insulin increased ROCK1 activity 2.1-fold in lean and 1.7-fold in obese nondiabetic subjects in muscle. However, ROCK1 activity did not increase in response to insulin in muscle of obese type 2 diabetic subjects without change in ROCK1 protein levels. Importantly, insulin-stimulated ROCK1 activity was positively correlated with insulin-mediated GDR in lean subjects (P < 0.01) but not in obese or type 2 diabetic subjects. Moreover, RhoE GTPase that inhibits the catalytic activity of ROCK1 by binding to the kinase domain of the enzyme is notably increased in obese type 2 diabetic subjects, accounting for defective ROCK1 activity. Thus, these data suggest that ROCK1 may play an important role in the pathogenesis of resistance to insulin action on glucose disposal in muscle of obese type 2 diabetic subjects.


Figures

Fig. 1.
Fig. 1.
Insulin receptor substrate-1 (IRS-1) tyrosine phosphorylation and IRS-1 protein levels in skeletal muscle of lean, obese nondiabetic, and obese diabetic subjects. All subjects underwent a 3-h hyperinsulinemic euglycemic clamp, and biopsies of vastus lateralis muscle were performed before and at the end of the clamp. A: muscle lysates (300–500 μg of protein) were subjected to immunoprecipitation (IP) with an IRS-1 antibody. The precipitated proteins were separated by SDS-PAGE and immunoblotted with an anti-phosphotyrosine antibody or anti-phospho-Ser632/635 IRS-1 antibody or an IRS-1 antibody. Note that the IRS-1 antibody reacts more strongly with the phosphorylated form of IRS-1 protein. Muscle lysates (50 μg) were separated by SDS-PAGE and transferred to nitrocellulose membranes. IRS-1 was visualized by immunoblotting (IB). The immunoblots shown are representative of 3 blots. B: bars show densitometric quantitation of IRS-1 phosphorylation from lean, obese, and obese type 2 diabetic subjects. Results are means ± SE for 9–10 subjects/group. *P < 0.01 vs. basal state; #P < 0.05 vs. lean or obese. C: bars show densitometric quantitation of IRS-1 protein levels from lean, obese, and obese type 2 diabetic subjects. The IRS-1 protein levels in the basal state are only quantitated. Results are means ± SE for 9–10 subjects/group.
Fig. 2.
Fig. 2.
Rho-kinase 1 (ROCK1) activity and ROCK1 protein amounts in skeletal muscle of lean, obese nondiabetic, and obese diabetic subjects. Subjects underwent clamp and biopsies as in Fig. 1. A: ROCK1 activity was measured in muscle lysates (300 μg) that were subjected to IP with a ROCK1 antibody. The immunoprecipitated pellets were separated by SDS-PAGE on 10% gel. The gel was stained with Coomassie blue, dried, and exposed to film. The gel was also transferred to nitrocellulose membranes and quantitated using a PhosphorImager. ROCK1 was visualized by IB. Muscle lysates (50 μg) were separated by SDS-PAGE and transferred to nitrocellulose membranes. ROCK1 was visualized by IB. The immunoblots shown are representative of 3 blots. B: bars show quantitation of ROCK1 activity from lean, obese, and obese type 2 diabetic subjects. Results are means ± SE for 8–9 subjects/group. &P < 0.05 vs. lean or obese for basal condition; #P < 0.05 vs. lean for insulin-stimulated condition. C: bars show densitometric quantitation of ROCK1 protein levels from lean, obese, and obese type 2 diabetic subjects. The ROCK1 protein levels in the basal state are only quantitated. Results are means ± SE for 9–10 subjects/group.
Fig. 3.
Fig. 3.
Correlation between insulin-stimulated ROCK1 activity and glucose disposal rate (GDR) in skeletal muscle of humans undergoing euglycemic hyperinsulinemic clamp. Correlation between insulin-stimulated ROCK1 activity and GDR in lean ( A), obese (B), and diabetic subjects (C) and the sum of lean, obese, and diabetic subjects (D). Each circle represents data from 1 subject. NS, not significant.
Fig. 4.
Fig. 4.
RhoA and RhoE protein amounts and ezrin and cofilin phosphorylation in skeletal muscle of lean, obese, nondiabetic, and obese diabetic subjects. A: proteins in muscle lysates (50 μg) were separated by SDS-PAGE and transferred to nitrocellulose membranes. RhoA, RhoE, ezrin, and cofilin were visualized by immunoblotting with specific antibodies. This blot is representative of 3 blots. BE: bars show densitometric quantitation of RhoA, RhoE, phosphorylated ezrin (p-ezrin), and p-cofilin levels from lean, obese, and obese type 2 diabetic subjects. Results are means ± SE for 8–10 subjects/group. *P < 0.01 vs. lean.

Similar articles

Cited by

References

    1. No authors listed Report of the Expert Committee on the Diagnosis and Classification of Diabetes Mellitus. Diabetes Care 21, Suppl 1: S5–S22, 1998 - PubMed
    1. Aguirre V, Werner ED, Giraud J, Lee YH, Shoelson SE, White MF. Phosphorylation of Ser307 in insulin receptor substrate-1 blocks interactions with the insulin receptor and inhibits insulin action. J Biol Chem 277: 1531–1537, 2002 - PubMed
    1. Amano M, Fukata Y, Kaibuchi K. Regulation and functions of Rho-associated kinase. Exp Cell Res 261: 44–51, 2000 - PubMed
    1. Begum N, Sandu OA, Ito M, Lohmann SM, Smolenski A. Active Rho kinase (ROK-alpha) associates with insulin receptor substrate-1 and inhibits insulin signaling in vascular smooth muscle cells. J Biol Chem 277: 6214–6222, 2002 - PubMed
    1. Björnholm M, Kawano Y, Lehtihet M, Zierath JR. Insulin receptor substrate-1 phosphorylation and phosphatidylinositol 3-kinase activity in skeletal muscle from NIDDM subjects after in vivo insulin stimulation. Diabetes 46: 524–527, 1997 - PubMed

Publication types

MeSH terms