

Mafa expression enhances glucose-responsive insulin secretion in neonatal rat beta cells
- PMID: 21190012
- PMCID: PMC3047400
- DOI: 10.1007/s00125-010-2026-z
Mafa expression enhances glucose-responsive insulin secretion in neonatal rat beta cells
Abstract
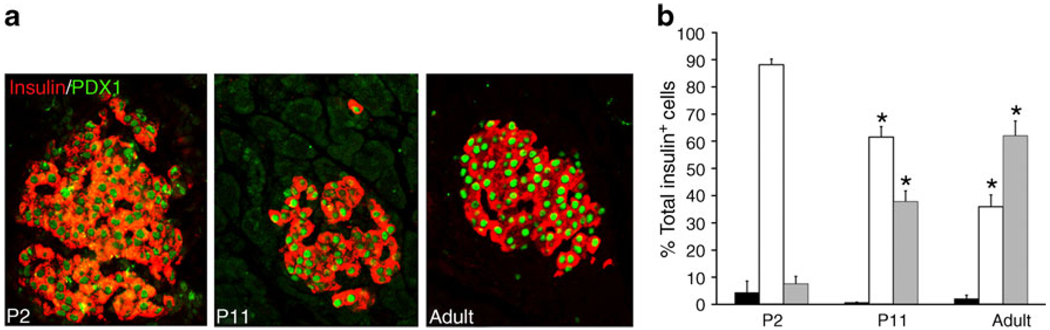
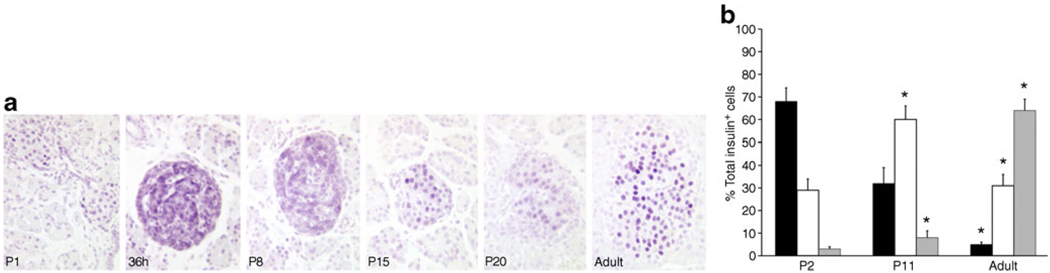
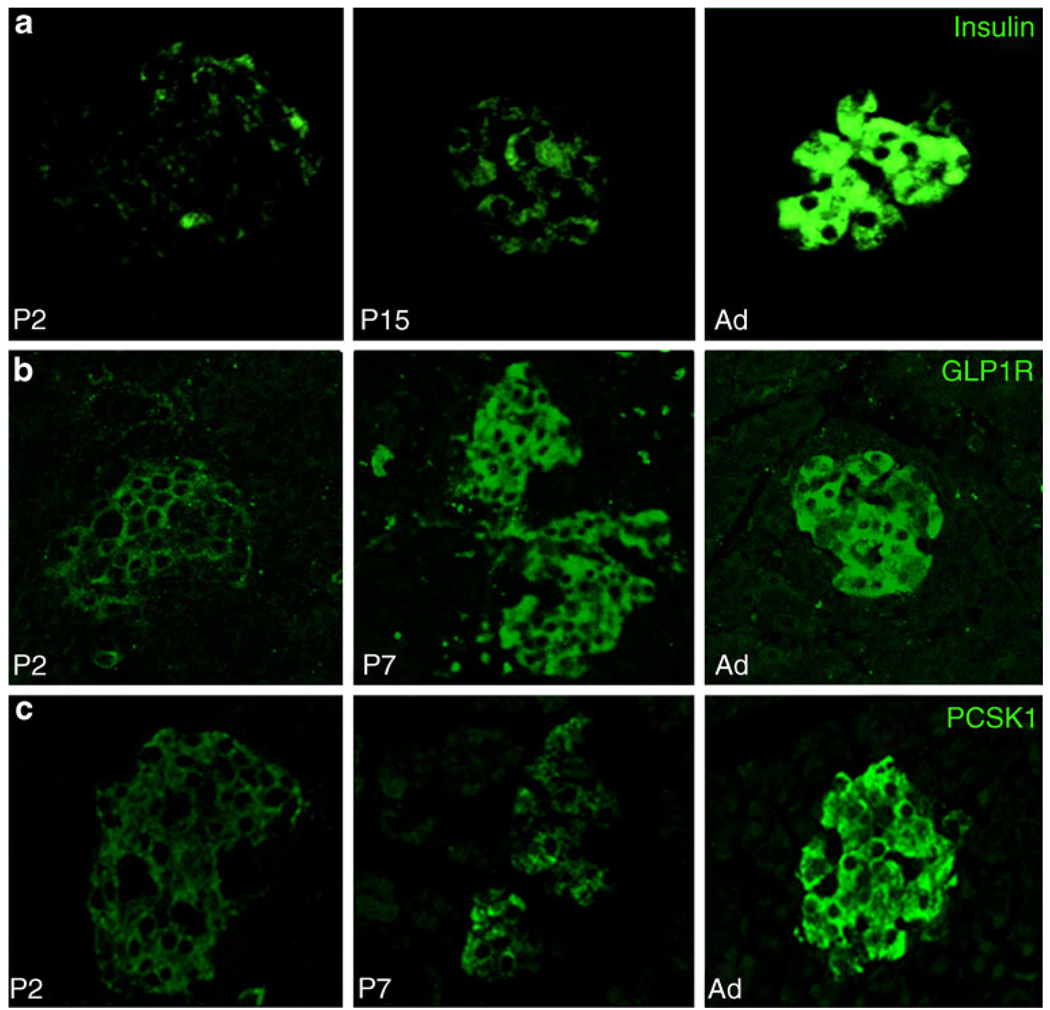
Aim/hypothesis: Neonatal beta cells lack glucose-stimulated insulin secretion and are thus functionally immature. We hypothesised that this lack of glucose responsiveness results from a generalised low expression of genes characteristic of mature functional beta cells. Important glucose-responsive transcription factors, Mafa and Pdx1, regulate genes involved in insulin synthesis and secretion, and have been implicated in late beta cell development. The aim of this study was to assess whether Mafa and/or Pdx1 regulates the postnatal functional maturation of beta cells.
Methods: By quantitative PCR we evaluated expression of these and other beta cell genes over the first month compared with adult. After infection with adenovirus expressing MAFA, Pdx1 or green fluorescent protein (Gfp), P2 rat islets were evaluated by RT-PCR and insulin secretion with static incubation and reverse haemolytic plaque assay (RHPA).
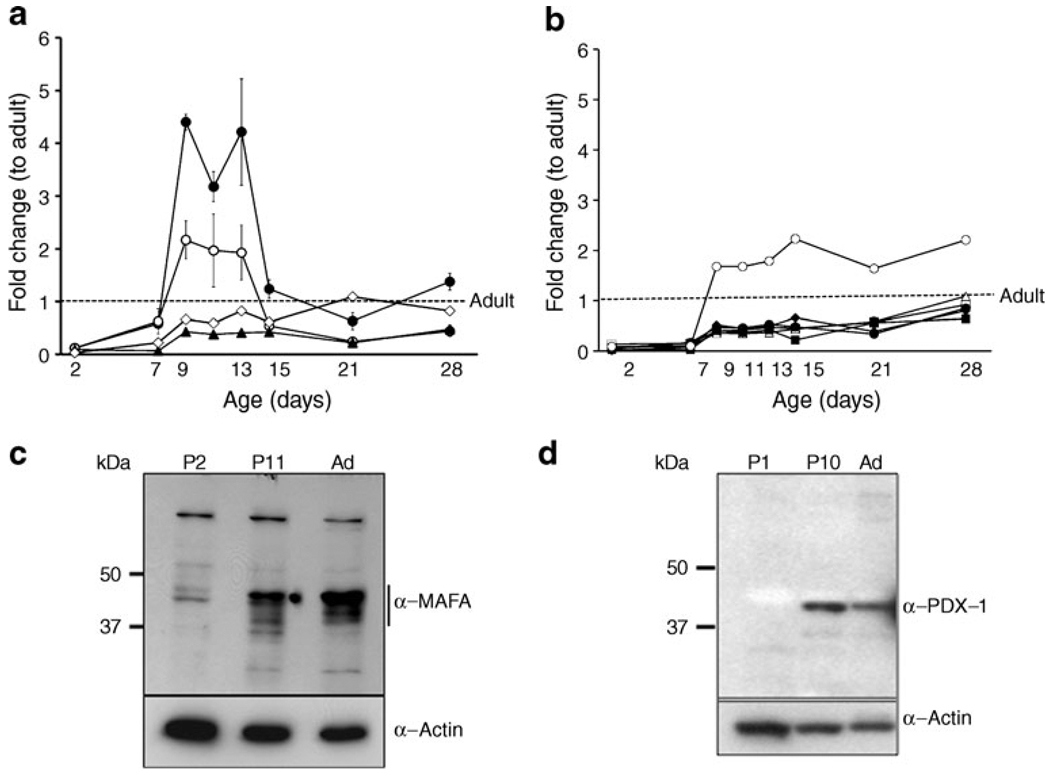
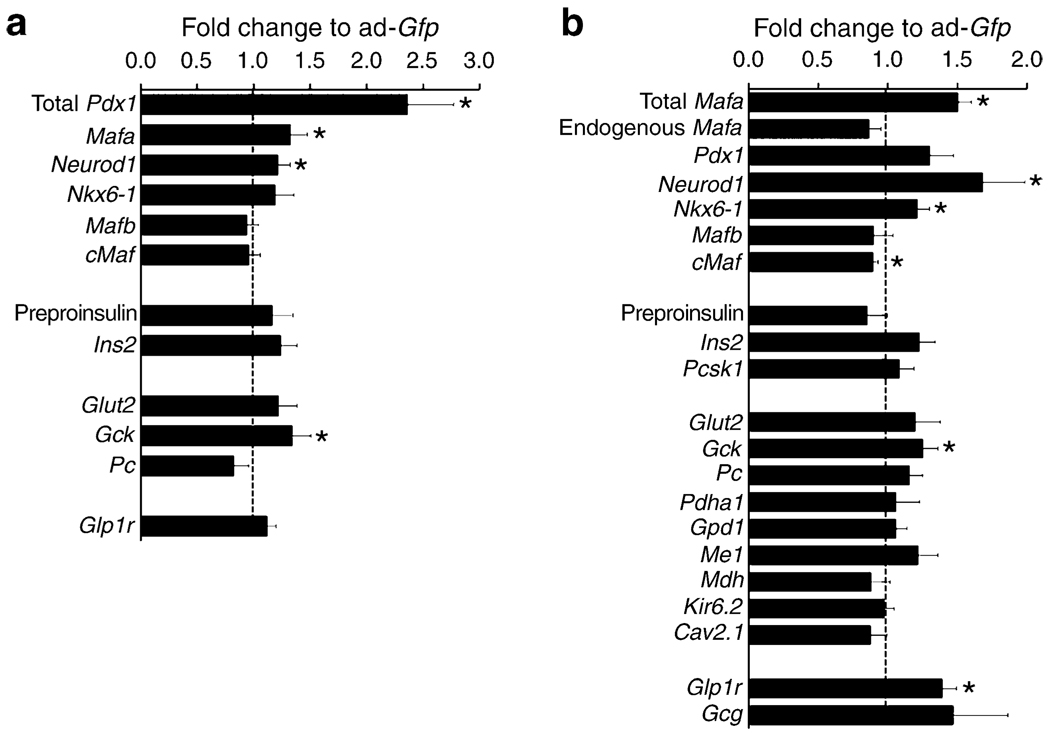
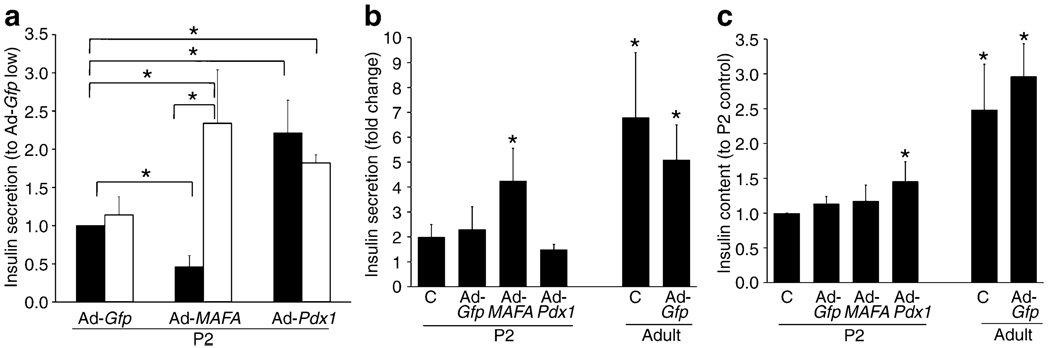
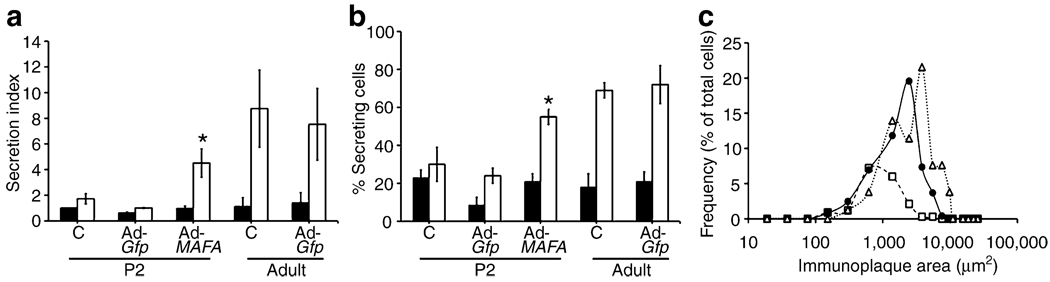
Results: At P2 most beta cell genes were expressed at about 10% of adult, but by P7 Pdx1 and Neurod1 no longer differ from adult; by contrast, Mafa expression remained significantly lower than adult through P21. Overexpression of Pdx1 increased Mafa, Neurod1, glucokinase (Gck) mRNA and insulin content but failed to enhance glucose responsiveness. Similar overexpression of MAFA resulted in increased Neurod1, Nkx6-1, Gck and Glp1r mRNAs and no change in insulin content but, importantly, acquisition of glucose-responsive insulin secretion. Both the percentage of secreting beta cells and the amount of insulin secreted per beta cell increased, approaching that of adult beta cells.
Conclusions/interpretation: In the process of functional maturation acquiring glucose-responsive insulin secretion, neonatal beta cells undergo a coordinated gene expression programme in which Mafa plays a crucial role.
Figures
Similar articles
-
The MafA-target gene PPP1R1A regulates GLP1R-mediated amplification of glucose-stimulated insulin secretion in β-cells.Metabolism. 2021 May;118:154734. doi: 10.1016/j.metabol.2021.154734. Epub 2021 Feb 23. Metabolism. 2021. PMID: 33631146
-
MafA promotes the reprogramming of placenta-derived multipotent stem cells into pancreatic islets-like and insulin+ cells.J Cell Mol Med. 2011 Mar;15(3):612-24. doi: 10.1111/j.1582-4934.2010.01034.x. J Cell Mol Med. 2011. PMID: 20158571 Free PMC article.
-
Differentiation of iPSCs into insulin-producing cells via adenoviral transfection of PDX-1, NeuroD1 and MafA.Diabetes Res Clin Pract. 2014 Jun;104(3):383-92. doi: 10.1016/j.diabres.2014.03.017. Epub 2014 Apr 1. Diabetes Res Clin Pract. 2014. PMID: 24794627
-
Role of the Transcription Factor MAFA in the Maintenance of Pancreatic β-Cells.Int J Mol Sci. 2022 Apr 19;23(9):4478. doi: 10.3390/ijms23094478. Int J Mol Sci. 2022. PMID: 35562869 Free PMC article. Review.
-
PDX1, Neurogenin-3, and MAFA: critical transcription regulators for beta cell development and regeneration.Stem Cell Res Ther. 2017 Nov 2;8(1):240. doi: 10.1186/s13287-017-0694-z. Stem Cell Res Ther. 2017. PMID: 29096722 Free PMC article. Review.
Cited by
-
In Vitro Assays to Identify Metabolism-Disrupting Chemicals with Diabetogenic Activity in a Human Pancreatic β-Cell Model.Int J Mol Sci. 2022 May 1;23(9):5040. doi: 10.3390/ijms23095040. Int J Mol Sci. 2022. PMID: 35563431 Free PMC article.
-
Reprogramming human gallbladder cells into insulin-producing β-like cells.PLoS One. 2017 Aug 16;12(8):e0181812. doi: 10.1371/journal.pone.0181812. eCollection 2017. PLoS One. 2017. PMID: 28813430 Free PMC article.
-
Regenerative Therapy of Type 1 Diabetes Mellitus: From Pancreatic Islet Transplantation to Mesenchymal Stem Cells.Stem Cells Int. 2016;2016:3764681. doi: 10.1155/2016/3764681. Epub 2016 Mar 7. Stem Cells Int. 2016. PMID: 27047547 Free PMC article. Review.
-
Dapagliflozin mitigates cellular stress and inflammation through PI3K/AKT pathway modulation in cardiomyocytes, aortic endothelial cells, and stem cell-derived β cells.Cardiovasc Diabetol. 2024 Oct 29;23(1):388. doi: 10.1186/s12933-024-02481-y. Cardiovasc Diabetol. 2024. PMID: 39472869 Free PMC article.
-
Deconstructing pancreas developmental biology.Cold Spring Harb Perspect Biol. 2012 Jun 1;4(6):a012401. doi: 10.1101/cshperspect.a012401. Cold Spring Harb Perspect Biol. 2012. PMID: 22587935 Free PMC article. Review.
References
-
- D’Amour KA, Bang AG, Eliazer S, et al. Production of pancreatic hormone-expressing endocrine cells from human embryonic stem cells. Nat Biotechnol. 2006;24:1392–1401. - PubMed
-
- Kroon E, Martinson LA, Kadoya K, et al. Pancreatic endoderm derived from human embryonic stem cells generates glucose-responsive insulin-secreting cells in vivo. Nat Biotechnol. 2008;26:443–452. - PubMed
-
- Freinkel N, Lewis NJ, Johnson R, Swenne I, Bone A, Hellerstrom C. Differential effects of age vs glycemic stimulation on the maturation of insulin stimulus-secretion coupling during culture of fetal rat islets. Diabetes. 1984;33:1028–1038. - PubMed
-
- Hellerstrom C, Swenne I. Functional maturation and proliferation of fetal pancreatic beta-cells. Diabetes. 1991;40 Suppl 2:89–93. - PubMed
-
- Bliss CR, Sharp GW. Glucose-induced insulin release in islets of young rats: time-dependent potentiation and effects of 2-bromostearate. Am J Physiol. 1992;263:E890–E896. - PubMed
Publication types
MeSH terms
Substances
Grants and funding
LinkOut - more resources
Full Text Sources
Other Literature Sources
Miscellaneous
