. 2010 Dec 29:8:154.
doi: 10.1186/1741-7007-8-154.

Curvature recognition and force generation in phagocytosis

Affiliations

Curvature recognition and force generation in phagocytosis

Margaret Clarke et al. BMC Biol. .

Abstract

Background: The uptake of particles by actin-powered invagination of the plasma membrane is common to protozoa and to phagocytes involved in the immune response of higher organisms. The question addressed here is how a phagocyte may use geometric cues to optimize force generation for the uptake of a particle. We survey mechanisms that enable a phagocyte to remodel actin organization in response to particles of complex shape.

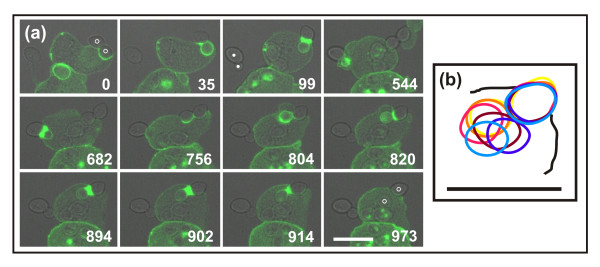
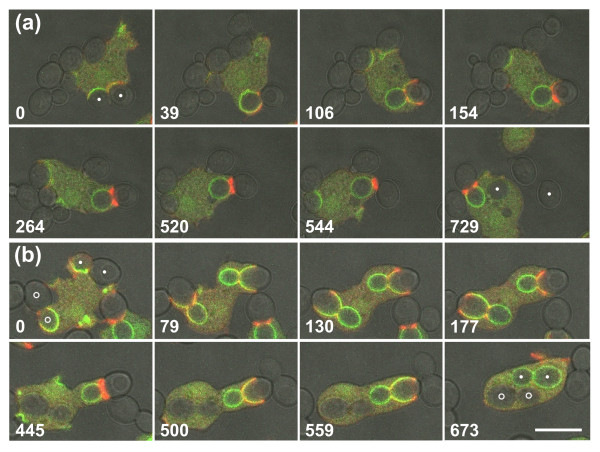
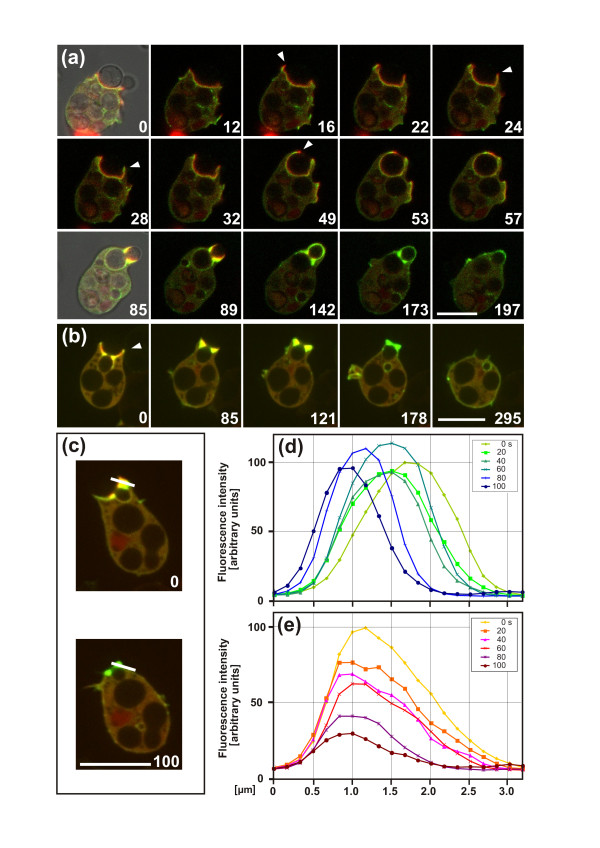
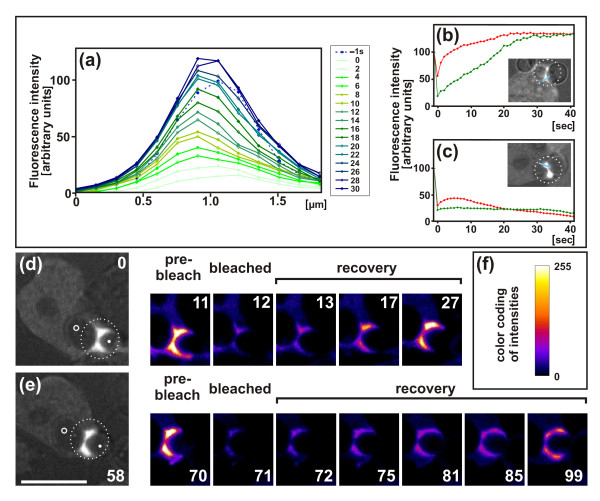
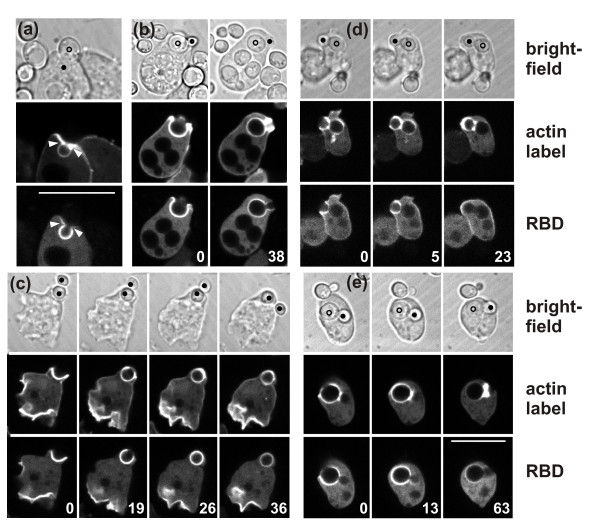
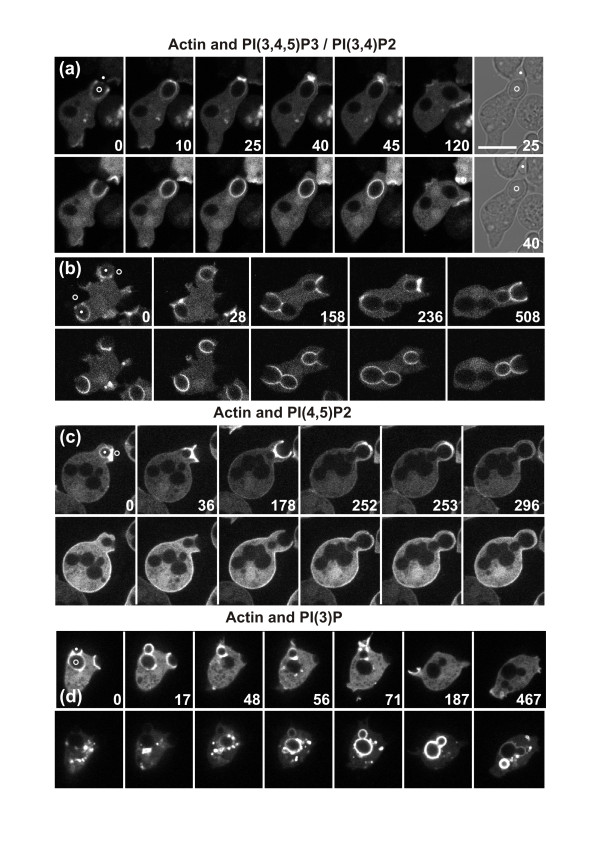
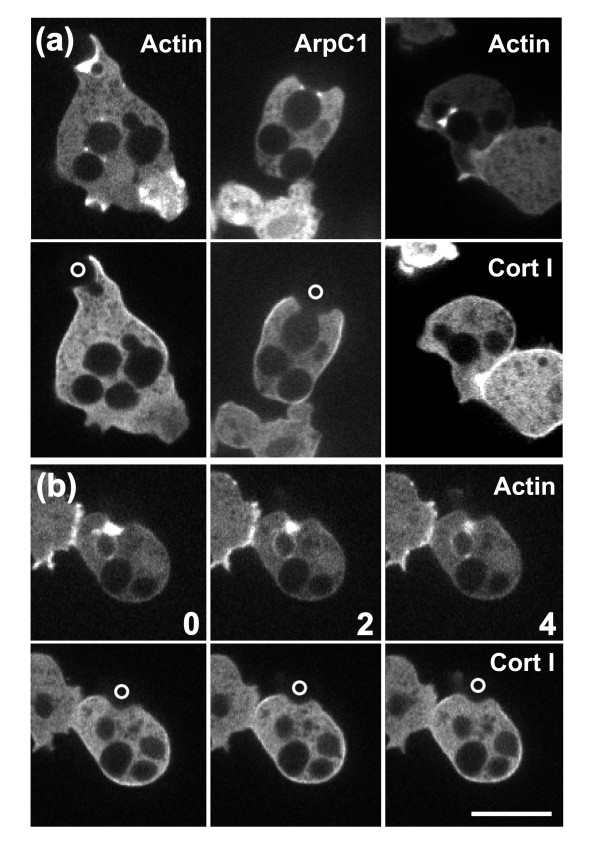
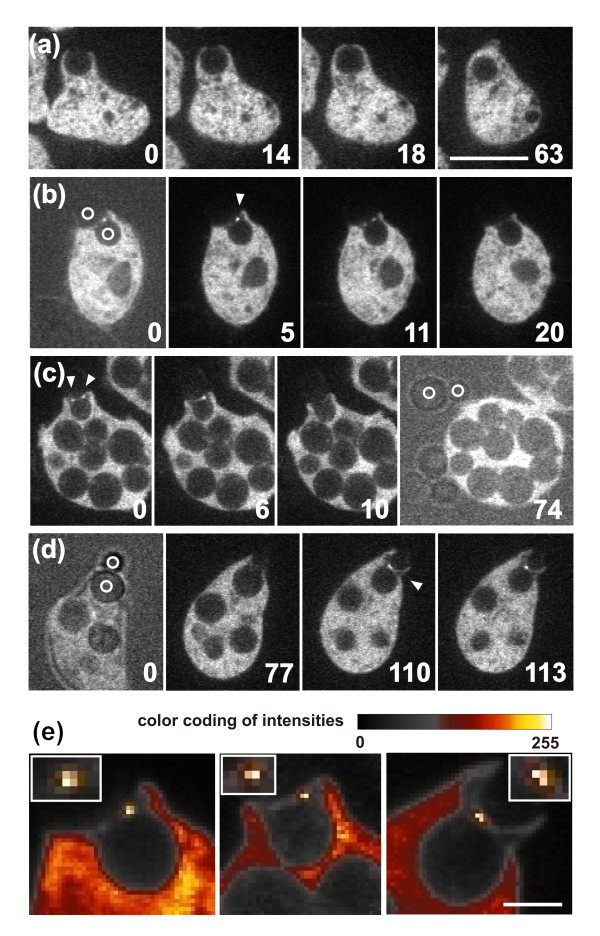
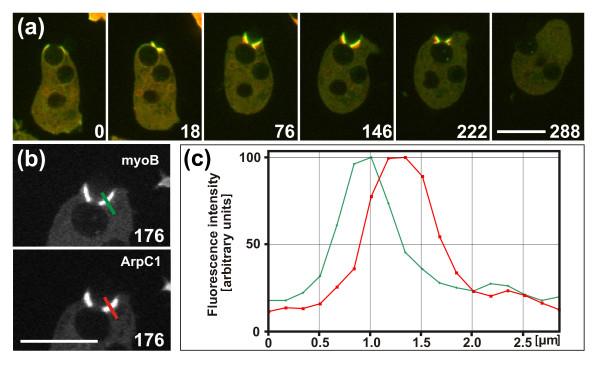
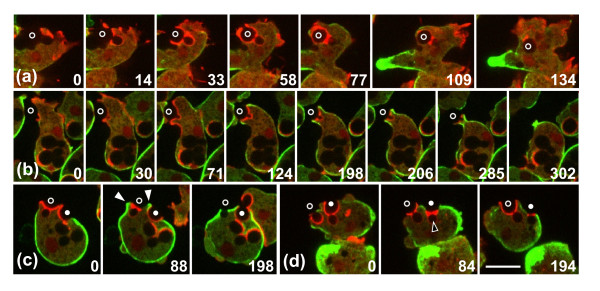
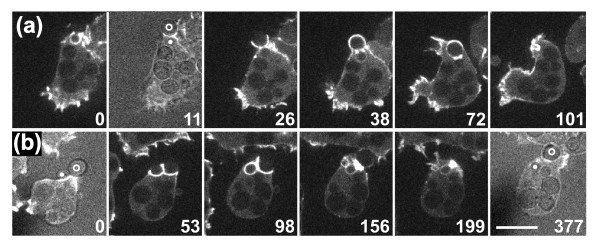
Results: Using particles that consist of two lobes separated by a neck, we found that Dictyostelium cells transmit signals concerning the curvature of a surface to the actin system underlying the plasma membrane. Force applied to a concave region can divide a particle in two, allowing engulfment of the portion first encountered. The phagosome membrane that is bent around the concave region is marked by a protein containing an inverse Bin-Amphiphysin-Rvs (I-BAR) domain in combination with an Src homology (SH3) domain, similar to mammalian insulin receptor tyrosine kinase substrate p53. Regulatory proteins enable the phagocyte to switch activities within seconds in response to particle shape. Ras, an inducer of actin polymerization, is activated along the cup surface. Coronin, which limits the lifetime of actin structures, is reversibly recruited to the cup, reflecting a program of actin depolymerization. The various forms of myosin-I are candidate motor proteins for force generation in particle uptake, whereas myosin-II is engaged only in retracting a phagocytic cup after a switch to particle release. Thus, the constriction of a phagocytic cup differs from the contraction of a cleavage furrow in mitosis.

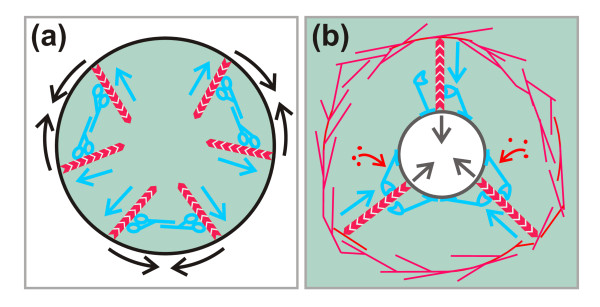
Conclusions: Phagocytes scan a particle surface for convex and concave regions. By modulating the spatiotemporal pattern of actin organization, they are capable of switching between different modes of interaction with a particle, either arresting at a concave region and applying force in an attempt to sever the particle there, or extending the cup along the particle surface to identify the very end of the object to be ingested. Our data illustrate the flexibility of regulatory mechanisms that are at the phagocyte's disposal in exploring an environment of irregular geometry.


Figures

Figure 1
Figure 1
Actin dynamics and force generation against a budded yeast particle. The cell expresses LimEΔ- GFP to label filamentous actin. (a) Time series showing the actin label in green superimposed on the greyscale brightfield image. The cell interacts first with the budded yeast on the right (circles indicating mother cell and bud), strongly accumulating actin around its neck. While this particle is released, the particle on the left (dots) is attacked in the same manner, again unsuccessfully. A second attempt on the first particle leads to severing of the linkage between mother and bud. Time is indicated in seconds. The complete series is shown in Additional file 1. (b) Particle movement before and after the severing event. Positions of the two halves of the particle are indicated at 4 second intervals from yellow through red to blue starting at 883 s of the sequence in (a). The cell border is indicated as a black contour. Whereas the outer part of the particle stays in place, the internalized one is moved about within the cell after severing of the linkage. Bars = 10 μm.
Figure 2
Figure 2
Decision making in the phagocytic response to positive and negative curvature. Fluorescence images of PHcrac-GFP (green) and mRFP-LimEΔ (red) are superimposed on greyscale brightfield images that show the shape of budded yeast particles. The two lobes of each particle are marked by dots or circles in the first and last frames of each series. Time is indicated in seconds. (a) Interplay of a Dictyostelium cell with a budded yeast, ending in severing of the particle. The cup extends halfway around the distal lobe of the particle (frame at 106 seconds) before retreating to the neck, where actin strongly accumulates (154 to 520 seconds). Finally, the particle is severed (544 to 729 seconds) and one lobe is internalized. (b) A similar sequence of events, but ending with complete uptake of the budded yeast labeled with dots. First, the cup extends up to part of the distal lobe (79 seconds). Subsequently the cup draws back to the neck of the particle (130 and 177 seconds) where actin strongly accumulates (445 seconds). Eventually the actin disassembles and the cup extends again (500 and 559 seconds), until the particle is completely engulfed (673 seconds). A third variant of interaction with a particle is exemplified by the budded yeast marked with circles at the left of the cell. Here the cup progresses continuously around the entire particle without a strong accumulation of actin at the neck. The complete series are shown in Additional files 2 and 3. Bar = 10 μm.
Figure 3
Figure 3
Coronin dynamics in particle uptake and release. Cells expressing GFP-coronin (green) and mRFP-LimEΔ (red) are exposed to budded yeast. (a) Complete uptake of budded yeast. In the frames at 0 and 85 seconds, brightfield images are superimposed on the fluorescence images to show particle shape. At 0 to 53 seconds, the extension of a cup occurs around the yeast mother cell, with a clear layering of coronin at the cytoplasmic face of the actin layer. During cup protrusion, actin precedes coronin at the edges of the cup (16 and 49 seconds, arrowheads). During expansion of the cup over the bud of the particle, the coronin label is again layered on the cytoplasmic face of the actin label (85 and 89 seconds). Subsequently, actin is disassembled (142 and 173 seconds), and finally coronin is dispersed upon closure of the cup (197 seconds). At stages of local retraction, coronin transiently replaces the actin at the rim (24 and 28 seconds, arrowheads). The complete series is shown in Additional file 4. (b) Partial uptake followed by release of budded yeast. The release starts with the green coronin label becoming prominent at the edge of the cup (0 seconds, arrowhead), followed by stratified accumulation of actin and coronin at the neck (85 and 121 seconds). Actin disappears gradually before coronin (178 seconds) before retraction of the cup is finished and the particle released (295 seconds). (c) Positions of the line scan displayed in (d) and (e) that measured the dynamics of coronin relative to actin disassembly. The scan has a width of 3 pixels. (d, e) Fluorescence intensities of (D) GFP-coronin and (E) mRFP-LimEΔ at the neck of a budded particle before its release, measured at intervals of 20 seconds. The fluorescence intensities are normalized to the highest value in the first frame of each of the two channels, which is set to 100. The scan direction from the phagosome to the cytoplasm is plotted from left to right. Because the phagosome was moving during the run, the scan positions had to be slightly readjusted to the actual border of the cup. Bars = 10 μm.
Figure 4
Figure 4
Fluorescence recovery after photobleaching (FRAP). Cells expressing GFP-actin were fed with budded yeast. For the analysis shown in (b) and (c) the cells expressed also mRFP-LimEΔ. The bleached areas are circumscribed by circles. (a) Fluorescence intensities of GFP-actin at the neck of a particle from the phagosome membrane (left) to the cytoplasmic space (right). Fluorescence recovery after bleaching was plotted at 2 second intervals and its temporal succession indicated by color-coding the plots from light green to blue. The pre-bleach scan (-1 second) is demarcated by a dotted line. (b) Fluorescence intensities integrated over the areas shown in the plot of (a). In this case, recovery even exceeded the pre-bleach values. Time of the first image after a bleaching pulse was set to zero. (c) Plot of integrated fluorescence intensities similar to (b), but recorded at a stage of net disassembly of actin. After the bleaching pulse, the LimEΔ marker bound to the remaining actin structures although the incorporation of fluorescent actin subunits had ceased. For (a to c) fluorescence intensities were determined along slices = 3 pixels in width through the actin-rich zone that surrounds the concave neck of a particle. In (b, c) fluorescence intensities were normalized by setting the pre-bleach values to100, and scan positions are shown in blue within the insets. Green curves represent fluorescence intensities of GFP-actin, red curves of mRFP-LimEΔ. (d, e) A cell that switches from (d) arrest of the cup at the neck of the particle to (e) cup progression around the entire particle. Mother cell (circle) and bud (dot) are demarcated in the panels at 0 and 58 seconds showing brightfield illumination superimposed on the fluorescence images. The entire sequence is shown in Additional file 5. Time is indicated in seconds after the first frame of (d). The first bleaching pulse was set between the frames taken at 11 and 12 seconds while the cup was arrested, and the second pulse between 70 and 71 seconds after cup extension had resumed. Bar = 10 μm. (f) Look-up table showing color coding of the eight-bit intensity scale used in (d) and (e).
Figure 5
Figure 5
Mapping of activated Ras relative to filamentous actin during the uptake of budded yeast. Cells were double-labeled with GFP fusions of Ras-binding domains (RBDs) and mRFP-LimEΔ. The RBDs of (a-c) human Raf-1 and (d, e) Dictyostelium NdrC kinase were used. Top panels show brightfield images of phagocytes and yeast (marked by dots or circles), middle panels fluorescence images of filamentous actin labeled with mRFP-LimEΔ, and bottom panels the simultaneously recorded localization of RBDs. (a) A stage of partial uptake showing actin accumulation at the neck of the bud, which is not paralleled by an enrichment of activated Ras (arrowheads). (b) Two stages of complete uptake, showing strong increase in the actin label at the bud, whereas the RBD label at this site remains low. (c) Sequence showing severing of a particle. At the time the outer part of the particle is cleaved off (26 seconds), the site of separation is not discriminated by its Ras activity. (d) Three stages of a complete uptake. The actin is increasing around the neck of the particle when the RBD label is already fading out. (e) Uptake of a particle that is finally released. Within the sequence comprising 1 minute, actin strongly accumulates at the bud neck, whereas RBD shows strongest binding at 13 seconds around the large mother cell. Numbers in (b-e) indicate seconds after the first frame. Bars = 10 μm; the bar in (e) applies also to (b-d).
Figure 6
Figure 6
Actin polymerization around budded yeast in relation to phosphoinositide localization. The paired images show the mRFP-LimEΔ label for filamentous actin (upper row in each time series) and the GFP-tagged biosensors for specific phosphoinositides (bottom rows). (a, b) The PH domain of CRAC, which binds to phosphoinositides PIP3 and PI(3,4)P2; (c) the PH domain of PLCδ, which binds to PI(4,5)P2. (d) The 2FYVE domain, which binds to PI(3)P. Time is indicated in seconds. In the first frames, the mother cell of the yeast is indicated by a circle, the bud by a dot. In (a) the particle is severed; the 25 and 40 seconds frames are brightfield images showing separation of the mother cell and bud. In (b-d) the particles are completely taken up. Bar = 10 μm.
Figure 7
Figure 7
Cortexillin depletion in phagocytic cups. The external portions of the budded yeast, which are not visible in the fluorescence images, are denoted by circles. The cells are expressing mRFP-LimEΔ for actin or mRFP-ArpC1 for the Arp2/3 complex (upper panels) together with GFP-cortexillin I (lower panels). (a) Three examples of uptake of budded yeast: (left panel) an early stage of uptake, (middle) an intermediate stage, and (right) completed uptake. At all stages, cortexillin I is uniformly depleted from the phagosome membrane, whereas actin and the Arp2/3 complex are enriched around the neck of the particle. (b) Sequence showing severing of a budded yeast with strong accumulation of actin around the neck of the particle. Cortexillin I is depleted from the entire cup at all stages of severing. Numbers indicate time in seconds. Bar = 10 μm for all images.
Figure 8
Figure 8
Localization of I-BARa-GFP during yeast uptake. (a) Uptake of an unbudded yeast. No accumulation of fluorescent IBARa at the cup that was formed around the spherical particle was detectable against the small, highly mobile clusters in the cytoplasm. (b-d) Partial uptake of budded yeast. Clusters of IBARa-GFP are indicated by arrowheads, positions of yeast mother cell and bud by circles. The IBARa protein disappeared from the neck region of the particle when uptake turned into release: 20 seconds in (b), and 10 seconds in (c). See Additional file 7 for the sequence shown in (d). In the 0 second images of (b, d) and the 74 seconds image of (c), the brightfield illumination is superimposed on the fluorescence image to show the budded yeast. (e) Quantification of fluorescence intensities of IBARa-GFP at the neck region of particles using a look-up table (color bar). Left panel, the cup in (b); middle panel, the cup in (c); right panel, the cup in (d). These images represent average projections over 10 frames (left), six frames (middle) or 14 frames (right) recorded at intervals of 0.5 seconds. For averaging, periods were selected in which the cup did not significantly move. Magnified regions of interest are shown in the inserts, demonstrating that the high fluorescence intensities are concentrated on about 2 pixels2. The pixel size is 168 × 168 nm. Time is indicated in seconds. Bar for (a-d) = 10 μm; Bar in (e) = 2 μm.
Figure 9
Figure 9
Patterns of MyoB and of the Arp2/3 complex around the neck of a budded yeast. (a) GFP-MyoB (green) and mRFP-ArpC1 (red) during partial uptake and release of the particle. The labels remained enriched for 3 minutes during arrest of the phagocytic cup at the neck of the particle and disappeared before the particle was released. For the complete series see Additional file 8. (b) One frame from the same time series as in (a), showing the fluorescences of GFP-MyoB (top) and mRFP-ArpC1 (bottom) in separate channels. The colored line indicates the scan position in (c). (c) Quantification of fluorescence distributions of MyoB (green) and ArpC1 (red) along the line scan denoted in (b). The highest values of fluorescence intensity are set to 100. Time is indicated in seconds after the first frame in (a). Bars = 10 μm.
Figure 10
Figure 10
Myosin-II engagement in particle release. Cells interacting with budded yeast express GFP -myosin-II heavy chains (green) and the mRFP -LimEΔ label for filamentous actin (red). Positions of the yeast mother cells are indicated by open or closed circles. Time is indicated in seconds. (a) Complete uptake of a particle, showing no myosin-II associated with the phagocytic cup, except a slight enrichment at the plasma membrane when the phagosome is closing (109 seconds). The cell has a long tail rich in myosin-II, which is shown in full length during its retraction at 109 and 134 seconds. (b) Attempted uptake and release of a particle carrying a small bud pointing toward the cell. Myosin-II does not associate with the cup as long as it grows (30 and 71 seconds), but strongly accumulates during retraction of the cup and release of the particle (124 to 285 seconds). (c) Partial uptake of a yeast particle (open circles) showing no accumulation of myosin-II during extension of the cup (0 frame). Subsequently myosin-II is recruited to the plasma membrane surrounding the retracting cup (88 seconds, closed arrowheads), but even then not to the actin-rich neck region. Myosin-II accumulation is again observed during retraction of a second cup (closed circles). Finally, the second particle is engulfed by another cell, where myosin-II is again missing during cup extension (198 seconds). (d) Simultaneous release of one particle (closed circles) and partial uptake of another (open circles). Actin, which strongly accumulates at the neck of the first particle, is not accompanied by myosin-II (84 seconds, open arrowhead). Eventually, the second particle is also released. The enrichment of myosin-II in the retracting cups occurs asynchronously for the two particles. Bar = 10 μm for all images.
Figure 11
Figure 11
Actin accumulation and severing of budded yeast in myosin-II-null cells. In mutant cells deficient in myosin-II heavy chains, filamentous actin is labeled with LimEΔ- GFP. Time series showing (a) complete uptake with actin accumulation at the neck of the particle; (b) a case of severing. Brightfield images showing particle shape are superimposed on the fluorescence images at 11 seconds in (a) and at 0 and 377 seconds in (b). In these frames, the mother cell and bud of the yeast are denoted by circles and dots, respectively. Time is indicated in seconds. The complete series is shown in Additional file 11. Bar = 10 μm for all images.
Figure 12
Figure 12
Diagram of proposed myosin-I action in phagocytic cup constriction compared with myosin-II function in the contraction of a cleavage furrow. (a) Schematic cross-section through a cleavage furrow. Contraction of the cleavage furrow in mitotic cells is reinforced by the conventional myosin-II that forms bipolar filaments with the motor domains pointing into opposite directions (blue). In this simplified scheme, actin filaments (red chevron polymers) attached with their (+) ends to the plasma membrane are assumed to point into the cytoplasmic space of the cleavage furrow, as suggested previously [77]. By moving in the (+) end direction (blue arrows), the myosin-II filaments apply force on the perimeter of the cleavage furrow, thus causing it to contract. (b) Schematic view of the orifice at the rim of a phagocytic cup at the neck of a budded yeast particle being engulfed (black circle). Actin filaments are again assumed to point from the plasma membrane into the cytoplasmic space. They act against a barrier of branched and cross-linked actin filaments in the cell cortex. Clusters of membrane-bound myosin-I molecules (blue) move by their motor domains in the (+) end direction (blue arrows) and are proposed to allow actin subunits to enter. The force applied against the barrier is postulated to cause the orifice of the bud to constrict or the neck of a particle to be severed (black arrows).

References

    1. Herant M, Heinrich V, Dembo M. Mechanics of neutrophil phagocytosis: behavior of the cortical tension. J Cell Sci. 2005;118:1789–1797. - PubMed
    1. Swanson JA, Johnson MT, Beningo K, Post P, Mooseker M, Araki N. A contractile activity that closes phagosomes in macrophages. J Cell Sci. 1999;112:307–316. - PubMed
    1. Champion JA, Mitragotri S. Role of target geometry in phagocytosis. Proc Natl Acad Sci USA. 2006;103:4930–4934. - PMC - PubMed
    1. Beningo KA, Wang YL. Fc-receptor-mediated phagocytosis is regulated by mechanical properties of the target. J Cell Sci. 2002;115:849–856. - PubMed
    1. Cornillon S, Pech E, Benghezal M, Ravanel K, Gaynor E, Letourneur F, Brückert F, Cosson P. Phg1p is a nine-transmembrane protein superfamily member involved in Dictyostelium adhesion and phagocytosis. J Biol Chem. 2000;275:34287–34292. - PubMed

Publication types

MeSH terms