. 2011 Jan 5;100(1):11-21.
doi: 10.1016/j.bpj.2010.11.011.

A model of the interaction between N-type and C-type inactivation in Kv1.4 channels

Affiliations

A model of the interaction between N-type and C-type inactivation in Kv1.4 channels

Glenna C L Bett et al. Biophys J. .

Abstract

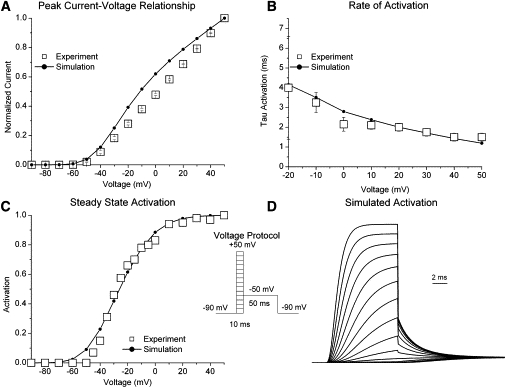
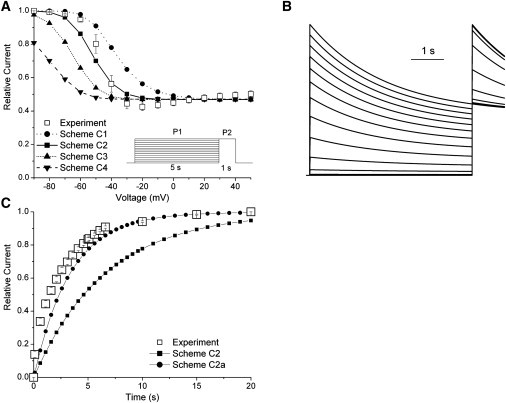
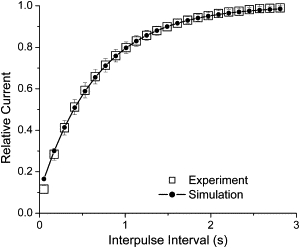
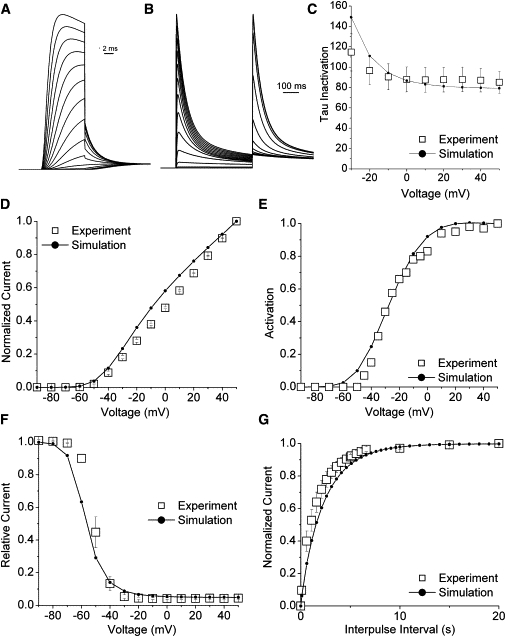
Kv1.4 channels are Shaker-related voltage-gated potassium channels with two distinct inactivation mechanisms. Fast N-type inactivation operates by a ball-and-chain mechanism. Slower C-type inactivation is not so well defined, but involves intracellular and extracellular conformational changes of the channel. We studied the interaction between inactivation mechanisms using two-electrode voltage-clamp of Kv1.4 and Kv1.4ΔN (amino acids 2-146 deleted to remove N-type inactivation) heterologously expressed in Xenopus oocytes. We manipulated C-type inactivation by introducing a lysine-tyrosine point mutation (K532Y, equivalent to Shaker T449Y) that diminishes C-type inactivation. We used experimental data to develop a comprehensive computer model of Kv1.4 channels to determine the interaction between activation and N- and C-type inactivation mechanisms needed to replicate the experimental data. C-type inactivation began at lower voltage preactivated states, whereas N-type inactivation was coupled directly to the open state. A model with distinct N- and C-type inactivated states was not able to reproduce experimental data, and direct transitions between N- and C-type inactivated states were required, i.e., there is coupling between N- and C-type inactivated states. C-type inactivation is the rate-limiting step determining recovery from inactivation, so understanding C-type inactivation, and how it is coupled to N-type inactivation, is critical in understanding how channels act to repetitive stimulation.


Figures

Figure 1
Figure 1
(A) Schematic representation of the Kv1.4 channel constructs used in this study. Kv1.4 is a typical voltage-gated channel with six transmembrane-spanning domains, one of which (S4) is charged and thought to be the voltage sensor. The N-terminal forms a ball and chain which can occlude the open channel. In the ΔN construct, amino acids 2–146 are deleted, removing the N-terminal and thus N-type inactivation. A lysine-to-tyrosine point mutation on the extracellular side of S6 was made (Kv1.4[K532Y]). This mutation drastically reduces the ability of the channel to undergo C-type inactivation. (B) Activation requires multiple closed states to reproduce the sigmoid onset of activation. Kv1.4 channels are tetramers, so we modeled the channel with four closed states. All transitions in the Markov model therefore correspond to the activation of one of the four subunits which form the basic core of the channel. The channel is only open, i.e., passes current, when all four subunits are activated.
Figure 2
Figure 2
Activation of Kv1.4 channels. (A) Peak I/V relationship from Kv1.4 ΔN. From a potential of −90 mV, oocytes were depolarized to potentials from −90 to + 50 mV. Experiment (□, n = 10) and simulation (●). (B) Rate of activation. Experiment (□, from Comer et al. (22) and simulation (●). (C) Steady-state activation was determined using the voltage protocol. (Inset) A 10-ms depolarizing step (P1) to potentials between −90 and +50 mV was followed by a (P2) step to −50 mV. Experiment (□, from Comer et al. (22)), and simulation (●). (D) Simulated current traces using the voltage protocol shown in the inset.
Figure 3
Figure 3
Coupling C-type Isochronal inactivation to activation in Kv1.4ΔN. A standard two-pulse protocol was used to measure isochronal inactivation. An initial 5 s P1 pulse was applied from the holding potential of −90 mV to potentials between −90 and + 50 mV in 10-mV steps. This was followed immediately by a 1 s P2 depolarization to +50 mV. (A) The peak current elicited by the P2 pulse was plotted as a fraction of the maximum value of the peak P1 current. Experiment (□, n = 5), and simulations from model C1 (●), model C2 (■), model C3 (▴), and model C4 (▾). (B) Simulated current from Model C2 using inset protocol in panel A. (C) Recovery from inactivation was measured using a standard variable interval gapped pulse protocol. The ratio of the peak current elicited by a 5 s depolarizing pulse from −90 to + 50 mV to the peak current elicited after a variable interval by a second 1 s pulse to + 50 mV was calculated to determine the degree of recovery from inactivation. Data are normalized from the value at time t = 0 to 20 s. Experiment (□, n = 6) and simulations of model C2 (●) and C2a (■).
Figure 4
Figure 4
The C-type inactivation model C2a coupled to the activation model. (A) Isochronal inactivation (compare to Fig. 3A) experiment (□, n = 5), and simulations from model C2a (●). (B) Rate of C-type inactivation from experiment (□, n = 7) and simulation (●).
Figure 5
Figure 5
Isochronal Inactivation. A 500-ms depolarization (P1) from the holding potential to potentials between −90 and +50 mV was followed by a second 500-ms pulse (P2) to +50 mV. The peak current elicited by P2 was plotted as a fraction of the peak P1 current. (A) Experimental data from Kv1.4 (□, n = 8), and Kv1.4[K532Y] (○, n = 8). Simulations are model N1 (●), N2 (♦), N3 (▴), and N4 (▾). (B) Simulated current of Model N1 coupled to the activation model.
Figure 6
Figure 6
Model N1 coupled to the activation model. (A) Rate inactivation from experiment (□, n = 8) and simulation (●). (B) Isochronal inactivation: experiment (□, n = 8) simulation (●).
Figure 7
Figure 7
Recovery from Inactivation of Kv1.4[K532Y]. A P1 pulse (1 s) was applied from −90 mV to +50 mV. This was followed after a variable interpulse interval by a 1 s P2 pulse to +50 mV. Peak current elicited by P2 was plotted as a fraction of the P1 peak current. Experiment (□, n = 8) and simulation (●).
Figure 8
Figure 8
Model WT1. (A) Isochronal inactivation: experiment (□, n = 5) and simulation (●). (B) Recovery from inactivation: experiment (□, n = 5) and simulation (●).
Figure 9
Figure 9
Model WT2. (A) Simulated current traces showing current activation using the protocol from Fig. 2D. (B) Simulated current traces from a two-pulse protocol with P1 (500 ms) to potentials between −90 and +50 mV in 10 mV steps and P2 (500 ms) to +50 mV. (C) Rate of inactivation Experiment (□, n = 5) and simulation (●). (D) Peak-current voltage for experiment (□, n = 8) and simulation (●). (E) Isochronal activation for experiment (□, from Comer et al. (22)) and simulation (●). (F) Isochronal inactivation: experiment (□, n = 5) and simulation (●). (G) Recovery from inactivation: experiment (□, n = 5) and simulation (●).
None
None
None
None
None
None
None
None
None
None
None

References

    1. Fergus D.J., Martens J.R., England S.K. Kv channel subunits that contribute to voltage-gated K+ current in renal vascular smooth muscle. Pflugers Arch. 2003;445:697–704. - PubMed
    1. Trimmer J.S., Rhodes K.J. Localization of voltage-gated ion channels in mammalian brain. Annu. Rev. Physiol. 2004;66:477–519. - PubMed
    1. Veh R.W., Lichtinghagen R., Pongs O. Immunohistochemical localization of five members of the Kv1 channel subunits: contrasting subcellular locations and neuron-specific co-localizations in rat brain. Eur. J. Neurosci. 1995;7:2189–2205. - PubMed
    1. Sheng M., Tsaur M.L., Jan L.Y. Subcellular segregation of two A-type K+ channel proteins in rat central neurons. Neuron. 1992;9:271–284. - PubMed
    1. Barry D.M., Nerbonne J.M. Myocardial potassium channels: electrophysiological and molecular diversity. Annu. Rev. Physiol. 1996;58:363–394. - PubMed

Publication types

Substances