. 2011 Mar;85(6):2878-90.
doi: 10.1128/JVI.00883-10. Epub 2010 Dec 29.

Vaccine-induced control of viral shedding following rhesus cytomegalovirus challenge in rhesus macaques

Affiliations

Vaccine-induced control of viral shedding following rhesus cytomegalovirus challenge in rhesus macaques

Kristina Abel et al. J Virol. 2011 Mar.

Abstract

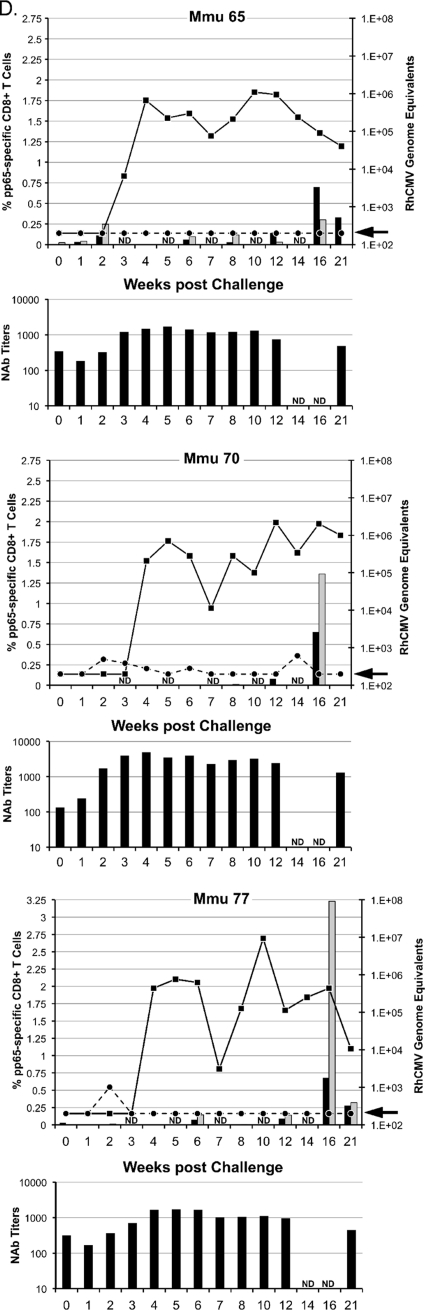
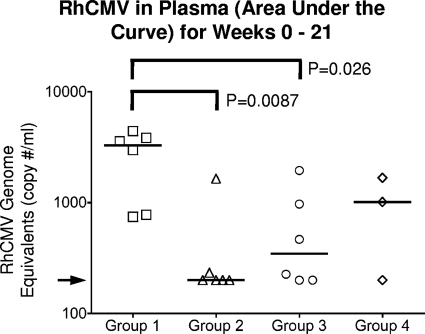
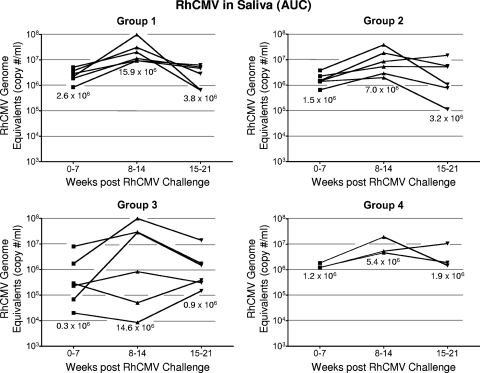
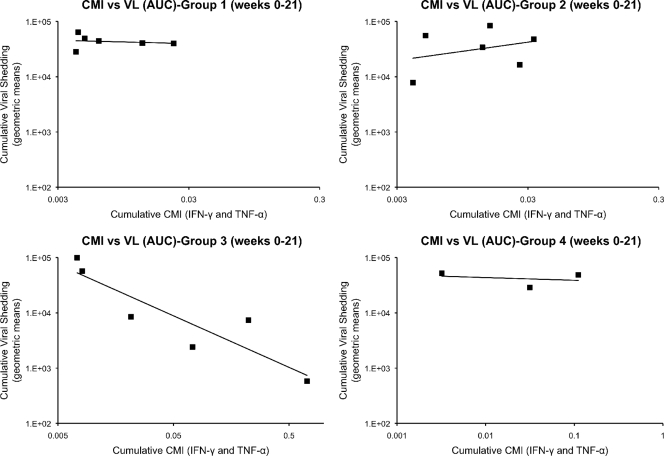
The use of animal models of human cytomegalovirus (HCMV) infection is critical to refine HCMV vaccine candidates. Previous reports have demonstrated that immunization of rhesus monkeys against rhesus cytomegalovirus (RhCMV) can reduce both local and systemic replication of RhCMV following experimental RhCMV challenge. These studies used prime/boost combinations of DNA expression plasmids alone or DNA priming and boosting with either inactivated virion particles or modified vaccinia virus Ankara (MVA) expressing the same antigens. Viral outcomes included reduced RhCMV replication at the site of subcutaneous inoculation and RhCMV viremia following intravenous inoculation. Since shedding of cytomegalovirus from mucosal surfaces is critical for horizontal transmission of the virus, DNA priming/MVA boosting was evaluated for the ability to reduce oral shedding of RhCMV following subcutaneous challenge. Of six rhesus monkeys vaccinated exclusively against RhCMV glycoprotein B (gB), phosphoprotein 65 (pp65), and immediate-early 1 (IE1), half showed viral loads in saliva that were lower than those of control monkeys by 1 to 3 orders of magnitude. Further, there was a strong association of memory pp65 T cell responses postchallenge in animals exhibiting the greatest reduction in oral shedding. These results highlight the fact that a DNA/MVA vaccination regimen can achieve a notable reduction in a critical parameter of viral replication postchallenge. The recently completed clinical trial of a gB subunit vaccine in which the rate of HCMV infection was reduced by 50% in the individuals receiving the vaccine is consistent with the results of this study suggesting that additional immunogens are likely essential for maximum protection in an outbred human population.


Figures

FIG. 1.
FIG. 1.
Fifty percent neutralizing antibody (NAb) titers for the four vaccine treatment groups at 14 weeks (2 weeks after the second booster MVA immunization) and 20 weeks (the time of RhCMV challenge). The median NAb titer for each group is represented by the solid line. The upper and lower dashed lines represent the normative range of NAb titers in long-term RhCMV-infected macaques (231 to 3,348; n = 24; mean = 973; median = 833 [unpublished data]). The arrows indicate the limit of detection (NAb < 10).
FIG. 2.
FIG. 2.
Viral and immune parameters in group 1 (A), 2 (B), 3 (C), and 4 (D) monkeys postchallenge. The upper graph for each animal in a group presents the RhCMV genome copy numbers per ml of plasma (dashed line) and saliva (solid line) postchallenge; the units for the RhCMV genome copy numbers are presented on the right y axis, relative to the time postchallenge at time zero (in weeks [x axis]). The arrow on each right y axis represents the minimum level of detection of RhCMV genomes/ml (200 copies). The percentages of pp65-specific CD8+ T cells (left y axis) expressing IFN-γ (black columns) and TNF-α (gray columns) were quantified by ICC at the time of challenge through 21 weeks after RhCMV challenge (x axis). ICC was not done (ND) at weeks 3, 5, 7, 10, and 14. The scale for the left y axis for Mmu 51 (group 3) (C) and Mmu 77 (group 4) (D) is different from that for all other animals. The lower graph for each animal represents the NAb titers (y axis) after RhCMV challenge (x axis). Titers are expressed as the reciprocal dilution achieving 50% neutralization of infection in fibroblasts (see Materials and Methods for details). NAb titers were not determined (ND) at weeks 14 and 16. The minimum level of NAb detection was 10. The three animals in group 3 (C) with poor control of RhCMV shedding in saliva are presented on the left half of panel C. The three animals of group 3 with more effective control of RhCMV shedding are presented on the right half of panel C (see the text for details).
FIG. 2.
FIG. 2.
Viral and immune parameters in group 1 (A), 2 (B), 3 (C), and 4 (D) monkeys postchallenge. The upper graph for each animal in a group presents the RhCMV genome copy numbers per ml of plasma (dashed line) and saliva (solid line) postchallenge; the units for the RhCMV genome copy numbers are presented on the right y axis, relative to the time postchallenge at time zero (in weeks [x axis]). The arrow on each right y axis represents the minimum level of detection of RhCMV genomes/ml (200 copies). The percentages of pp65-specific CD8+ T cells (left y axis) expressing IFN-γ (black columns) and TNF-α (gray columns) were quantified by ICC at the time of challenge through 21 weeks after RhCMV challenge (x axis). ICC was not done (ND) at weeks 3, 5, 7, 10, and 14. The scale for the left y axis for Mmu 51 (group 3) (C) and Mmu 77 (group 4) (D) is different from that for all other animals. The lower graph for each animal represents the NAb titers (y axis) after RhCMV challenge (x axis). Titers are expressed as the reciprocal dilution achieving 50% neutralization of infection in fibroblasts (see Materials and Methods for details). NAb titers were not determined (ND) at weeks 14 and 16. The minimum level of NAb detection was 10. The three animals in group 3 (C) with poor control of RhCMV shedding in saliva are presented on the left half of panel C. The three animals of group 3 with more effective control of RhCMV shedding are presented on the right half of panel C (see the text for details).
FIG. 3.
FIG. 3.
Area under the curve (AUC) of RhCMV in plasma over the course of 21 weeks of postchallenge observation. The median AUC for each group is represented by the solid line. The arrow indicates the level of detection for RhCMV DNA (200 RhCMV genomes/ml of saliva).
FIG. 4.
FIG. 4.
Longitudinal AUCs of RhCMV in saliva for weeks 0 to 7, 8 to 14, and 15 to 21. The median AUC of RhCMV for each group during each interval of time is indicated. The genome copies are expressed as copy number/ml on the indicated left axis.
FIG. 5.
FIG. 5.
RhCMV viral loads (VL) versus cell-mediated immunity (CMI) responses to RhCMV pp65. The geometric means of the RhCMV viral loads in saliva for weeks 0 to 21 after RhCMV challenge and the cellular immune responses to pp65 (both IFN-γ and TNF-α) were plotted for each animal group. The geometric means (mean of logs, transformed back to the original scale) were calculated after a limit of detection was added to establish a value for zeroes. The limit of detection for RhCMV DNA in saliva was 200 and one-half of the smallest nonzero value for IFN-γ and TNF-α (0.0001 and 0.0005, respectively). A statistically significant association of CMI and oral shedding was observed only in group 3 (P = 0.015, 1 degree of freedom, F = 16.9).

Similar articles

Cited by

References

    1. Abel, K., et al. 2006. Rapid virus dissemination in infant macaques after oral simian immunodeficiency virus exposure in the presence of local innate immune responses. J. Virol. 80:6357-6367. - PMC - PubMed
    1. Abel, K., et al. 2008. A heterologous DNA prime/protein boost immunization strategy for rhesus cytomegalovirus. Vaccine 26:6013-6025. - PMC - PubMed
    1. Arora, N., Z. Novak, K. B. Fowler, S. B. Boppana, and S. A. Ross. 2010. Cytomegalovirus viruria and DNAemia in healthy seropositive women. J. Infect. Dis. 202:1800-1803. - PMC - PubMed
    1. Asher, D. M., J. C. J. Gibbs, D. J. Lang, D. C. Gadjusek, and R. M. Chanock. 1974. Persistent shedding of cytomegalovirus in the urine of healthy rhesus monkeys. Proc. Soc Exp. Biol. Med. 145:794-801. - PubMed
    1. Asher, D. M., C. J. Gibbs, Jr., and D. J. Lang. 1969. Rhesus monkey cytomegaloviruses: persistent asymptomatic viruses. Bacteriol. Proc. 69:191.

Publication types

MeSH terms