. 2011 Jan 18;108(3):1052-7.
doi: 10.1073/pnas.1015397108. Epub 2010 Dec 29.

Spatial gradient of protein phosphorylation underlies replicative asymmetry in a bacterium

Affiliations

Spatial gradient of protein phosphorylation underlies replicative asymmetry in a bacterium

Y Erin Chen et al. Proc Natl Acad Sci U S A. .

Abstract

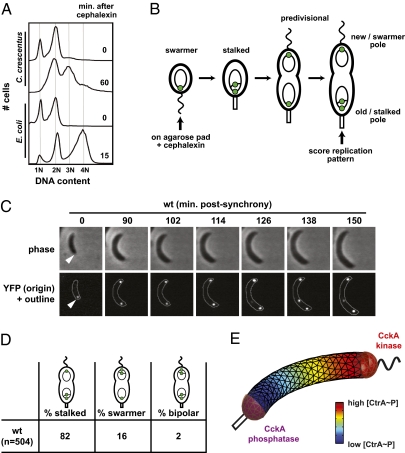
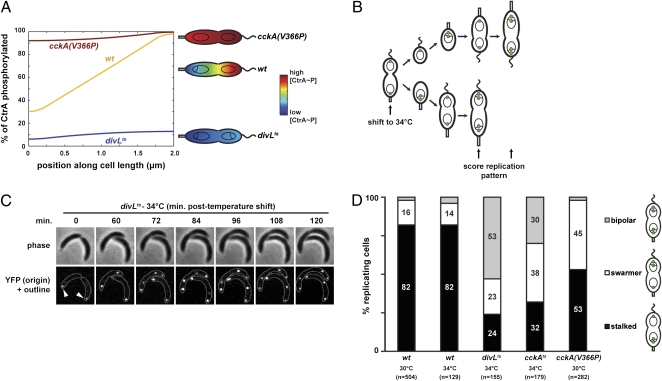
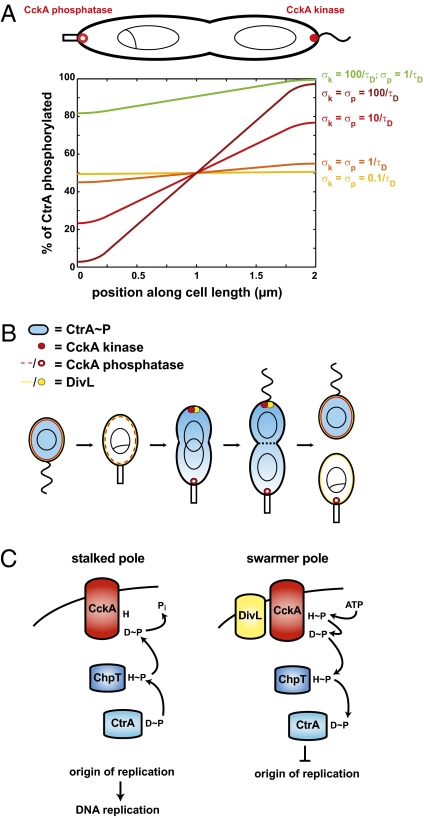
Spatial asymmetry is crucial to development. One mechanism for generating asymmetry involves the localized synthesis of a key regulatory protein that diffuses away from its source, forming a spatial gradient. Although gradients are prevalent in eukaryotes, at both the tissue and intracellular levels, it is unclear whether gradients of freely diffusible proteins can form within bacterial cells given their small size and the speed of diffusion. Here, we show that the bacterium Caulobacter crescentus generates a gradient of the active, phosphorylated form of the master regulator CtrA, which directly regulates DNA replication. Using a combination of mathematical modeling, single-cell microscopy, and genetic manipulation, we demonstrate that this gradient is produced by the polarly localized phosphorylation and dephosphorylation of CtrA. Our data indicate that cells robustly establish the asymmetric fates of daughter cells before cell division causes physical compartmentalization. More generally, our results demonstrate that uniform protein abundance may belie gradients and other sophisticated spatial patterns of protein activity in bacterial cells.


Conflict of interest statement

The authors declare no conflict of interest.

Figures

Fig. 1.
Fig. 1.
Chromosomal replication in wild-type predivisional cells exhibits spatial asymmetry. (A) Flow cytometry analysis of DNA content in mixed populations of C. crescentus and E. coli cells. Cephalexin was added to cultures at time t = 0 to inhibit cell division. Samples were taken immediately or after 15 min (E. coli) or 60 min (Caulobacter) and chromosome content examined by flow cytometry. (B) Experimental design for using the tetO, TetR-YFP FROS to examine DNA replication in individual cells. At time t = 0, newly synchronized swarmer cells are placed on an agarose pad supplemented with cephalexin and imaged at various time points by phase and epifluorescence microscopy. Green dots represent fluorescent foci of TetR-YFP, which label the origins of replication. (C) Representative time-lapse images from a wild-type cell harboring the tet FROS. A single origin at the old/stalked pole (arrowhead) replicates within the first 90 min to yield two polar origins. A third origin stemming from the stalked pole is visible after the 126-min time point. (D) Quantification of the spatial patterns of DNA replication in division-inhibited wild-type cells. (E) Computational modeling of CtrA~P asymmetry when CckA functions as a kinase at the swarmer pole and as a phosphatase at the stalked pole (phosphorylation and dephosphorylation rates are σk = 100/s and σp = 10/s, respectively, and occur across the hemispherical surfaces indicated in red). The predivisional cell is represented as a 3D curved cylinder with length 4 μm. Small triangles represent the surfaces of tetrahedral simulation grid points, and the concentration of CtrA~P is shaded relative to total CtrA protein.
Fig. 2.
Fig. 2.
CtrA activity is required for replication asymmetry in predivisional cells. (A) Mathematical modeling of the spatial distribution of CtrA phosphorylation in wild-type and mutant strains disrupted for CckA kinase activity (divLts) or CckA phosphatase activity [cckA(V366P)]. For wild type the phosphorylation and dephosphorylation rates, σk and σp, respectively, are 100/s and 10/s; for divLts, σk = 0; for cckA(V366P), σp = 0. The predicted patterns of CtrA~P relative to the total CtrA concentration are shown as a function of position along a 1D, 2-μm cell and in the predivisional cell schematics. (B) Experimental design for examining DNA replication in cckAts and divLts cells. At time t = 0, a mixed population of cells harboring the tet fluorescent reporter-operator system and grown at 28 °C (cckAts) or 30 °C (divLts) was placed on an agarose pad for microscopy at 34 °C. Phase contrast and epifluorescence microscopy were used to follow late predivisional cells that divided immediately after beginning a time-lapse movie. Both daughter cells inherit a single chromosome that replicates, leading to two origin foci. At the restrictive temperature of 34 °C, cckAts and divLts cells do not divide; we then examined the spatial pattern of subsequent DNA replication events. (C) Frames from a representative time-lapse movie of divLts cells showing bipolar replication (left cell) and unipolar replication from the stalked pole (right cell). (D) Quantification of the spatial patterns of DNA replication in wild-type, cckAts, divLts, and cckA(V366P) cells. Temperatures and numbers of replicating cells examined are indicated.
Fig. 3.
Fig. 3.
Asymmetry of replication depends on direct CtrA repression of the origin. (A) Schematic of CtrA binding sites in the origin of replication of wild type and the “bd” and “bcLd” mutants (20), which have mutations in two or three sites, respectively. (B) Quantification of spatial patterns of DNA replication in wild-type and origin mutants. Cells were examined as in Fig. 2C at 30 °C. (C) Markov model for concentration dependence of the average time before all CtrA~P binding sites are left unoccupied, thereby allowing for DNA replication initiation. Rates of binding (σb = 0.001/s) and unbinding (σu = 0.005/s) were selected to reproduce the average firing time in wild-type cells. Polar concentrations (dashed lines) were translated into approximate molecule counts using a DNA-interaction volume of 105 nm3, and the heights of the shaded triangles indicate the degree of asymmetry between the stalked pole (Left) and swarmer pole (Right). As the number of CtrA binding sites increases from two to four (green line to red line), the height of the shaded triangle increases, indicating an expected increase in the asymmetry of firing times between the stalked and swarmer poles.
Fig. 4.
Fig. 4.
Both kinase and phosphatase activities of CckA must be fast to produce a CtrA~P gradient. (A) Mathematical modeling of the spatial asymmetry in CtrA~P across a 1D cell for varying kinase and phosphatase rates. A substantial gradient is obtained only when CtrA phosphorylation and dephosphorylation are faster than the inverse of the time scale required for diffusion across the cell, 1/τD = 2D/L2. Degradation and synthesis are not included in these simulations because they have little effect on the gradient unless the half-life is shorter than τD. (B) Schematic of protein localization patterns in Caulobacter resulting in formation of a gradient of CtrA~P in predivisional cells. Cell division reinforces the asymmetric distribution of CtrA~P, resulting in daughter cells with different replicative capacities and fates. (C) Schematic of the CckA/ChpT/CtrA phosphorelay. When stimulated by DivL at the swarmer pole, CckA operates as a kinase, resulting in phosphorylation of ChpT and, ultimately, CtrA. When unstimulated at the stalked pole, CckA operates as a phosphatase, driving dephosphorylation of CtrA~P.

References

    1. Lander AD. Morpheus unbound: Reimagining the morphogen gradient. Cell. 2007;128:245–256. - PubMed
    1. Dehmelt L, Bastiaens PI. Spatial organization of intracellular communication: Insights from imaging. Nat Rev Mol Cell Biol. 2010;11:440–452. - PubMed
    1. Parent CA, Blacklock BJ, Froehlich WM, Murphy DB, Devreotes PN. G protein signaling events are activated at the leading edge of chemotactic cells. Cell. 1998;95:81–91. - PubMed
    1. Berg HC, Purcell EM. Physics of chemoreception. Biophys J. 1977;20:193–219. - PMC - PubMed
    1. Raskin DM, de Boer PA. MinDE-dependent pole-to-pole oscillation of division inhibitor MinC in Escherichia coli. J Bacteriol. 1999;181:6419–6424. - PMC - PubMed

Publication types

MeSH terms

LinkOut - more resources