. 2010 Dec 30:10:291.
doi: 10.1186/1471-2229-10-291.

Conjugated polymer nanoparticles for effective siRNA delivery to tobacco BY-2 protoplasts

Affiliations

Conjugated polymer nanoparticles for effective siRNA delivery to tobacco BY-2 protoplasts

Asitha T Silva et al. BMC Plant Biol. .

Abstract

Background: Post transcriptional gene silencing (PTGS) is a mechanism harnessed by plant biologists to knock down gene expression. siRNAs contribute to PTGS that are synthesized from mRNAs or viral RNAs and function to guide cellular endoribonucleases to target mRNAs for degradation. Plant biologists have employed electroporation to deliver artificial siRNAs to plant protoplasts to study gene expression mechanisms at the single cell level. One drawback of electroporation is the extensive loss of viable protoplasts that occurs as a result of the transfection technology.

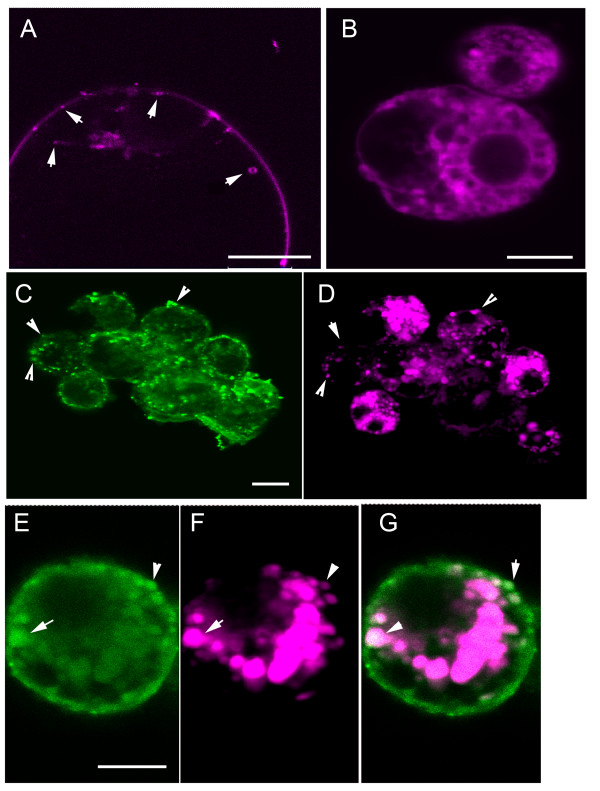
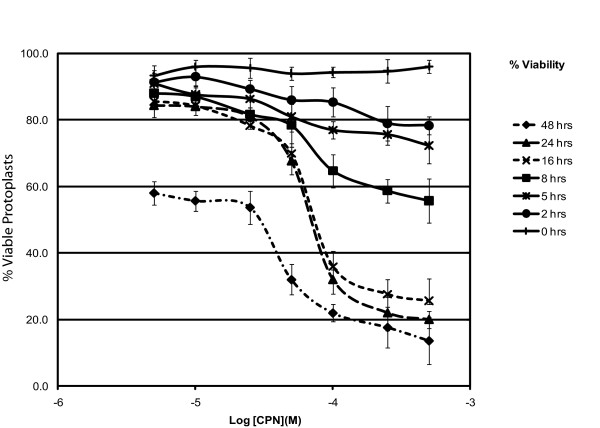
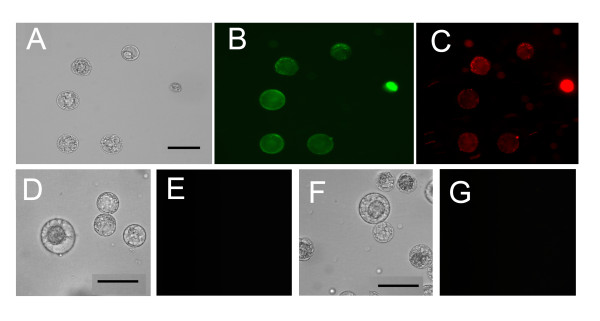
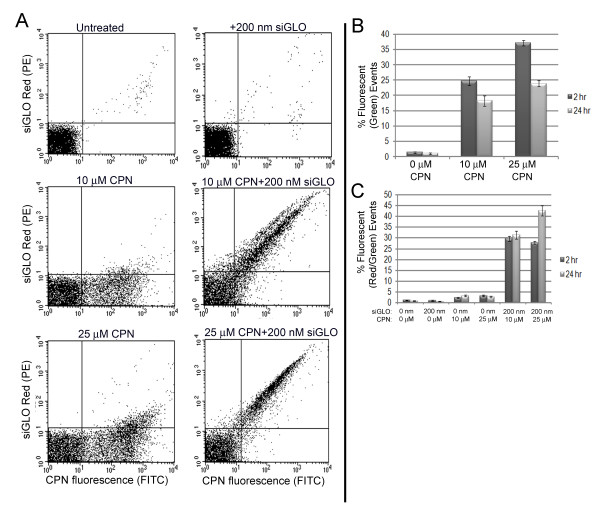
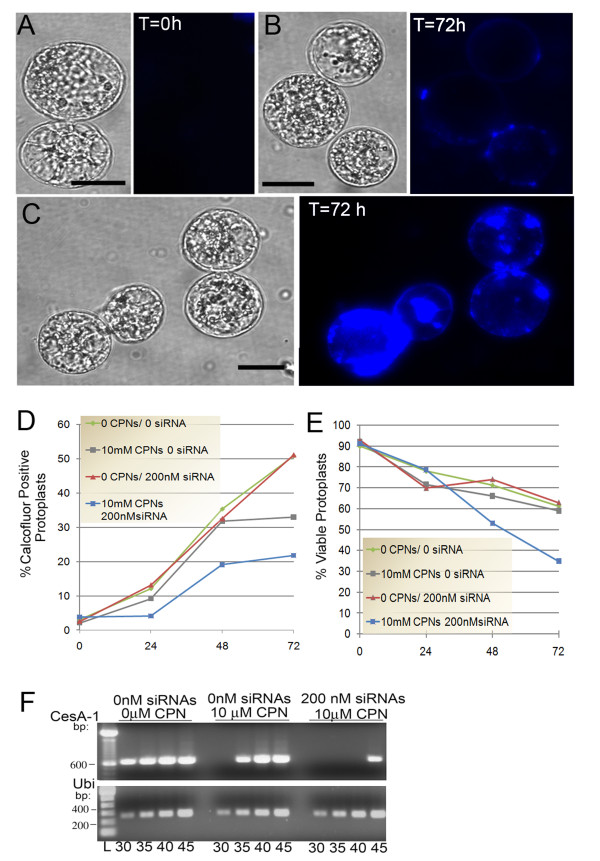
Results: We employed fluorescent conjugated polymer nanoparticles (CPNs) to deliver siRNAs and knockdown a target gene in plant protoplasts. CPNs are non toxic to protoplasts, having little impact on viability over a 72 h period. Microscopy and flow cytometry reveal that CPNs can penetrate protoplasts within 2 h of delivery. Cellular uptake of CPNs/siRNA complexes were easily monitored using epifluorescence microscopy. We also demonstrate that CPNs can deliver siRNAs targeting specific genes in the cellulose biosynthesis pathway (NtCesA-1a and NtCesA-1b).

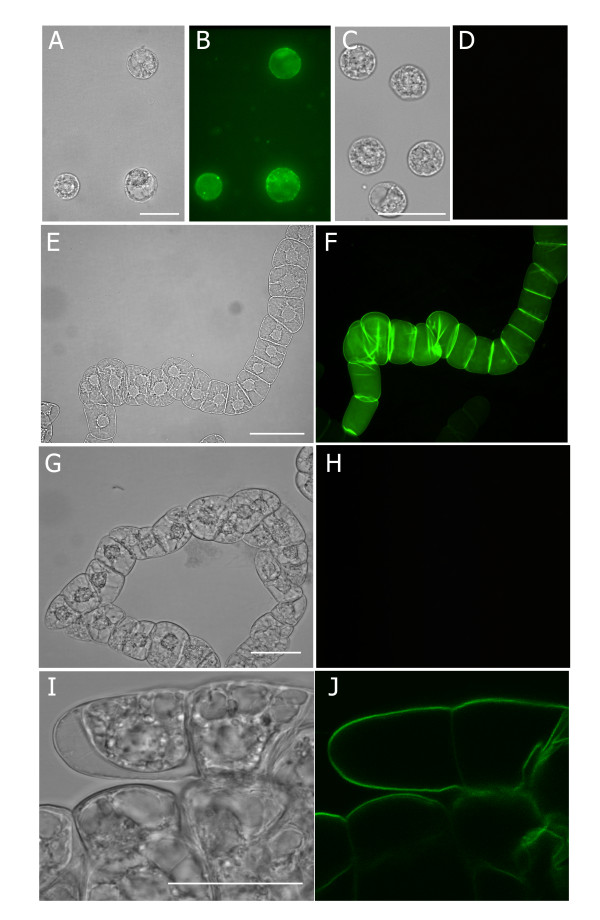
Conclusions: While prior work showed that NtCesA-1 is a factor involved in cell wall synthesis in whole plants, we demonstrate that the same gene plays an essential role in cell wall regeneration in isolated protoplasts. Cell wall biosynthesis is central to cell elongation, plant growth and development. The experiments presented here shows that NtCesA is also a factor in cell viability. We show that CPNs are valuable vehicles for delivering siRNAs to plant protoplasts to study vital cellular pathways at the single cell level.


Figures

Figure 1
Figure 1
CPN-treated BY-2 cells and protoplasts. Panels show bright field and fluorescence images. (A,B) BY-2 protoplasts were incubated for 2 h with 10 μM CPNs or (C, D) left untreated. (E, F) Chains of attached BY-2 cells treated with 10 μM CPNs for 2 h. Green fluorescence is greatest at the cross walls suggesting that CPNs attach to the cell walls and do not penetrate the interior. (G, H) Images of untreated BY-2 cells at 2 h. (I, J) Confocal images of intact BY-2 cells treated with 10 μM CPNs at 24 h. Experiments were repeated with similar results. Single optical section through the center of the cell shows fluorescence along the cell wall and does not penetrate the interior. Scale bars equal 50 μm.
Figure 2
Figure 2
CPN and FM4-64 treated BY-2 protoplasts examined using confocal microscopy. (A) Protoplast that was treated with medium (no CPNs) and then FM4-64 for 10 min or (B) more than 20 min. FM4-64 fluorescence is in the plasma membrane and vesicles budding from the plasma membrane at 10 min. Following a 20 min or longer incubation, red fluorescence is in the plasma membrane, perinuclear membranes, and intracellular vesicles. Arrow heads point to vesicles budding at the plasma membrane and in the cortical region. (C, D) Green and red fluorescent images of protoplasts treated with CPNs and then FM4-64 for 10 min. Arrow heads point to vesicles along the plasma membrane that contain both green and red fluorescence. There are a greater number of red than green fluorescent vesicles. However, most green granules also contain red fluorescence. (E, F, G) Protoplasts were treated with CPNs and then FM4-64 for 20 min showed green and red fluorescence in vesicles along the periphery of the cell. Repeated experiments showed similar outcomes. Arrows point to examples where green and red fluorescence overlap. Scale bars equal 20 μm.
Figure 3
Figure 3
Protoplast viability was determined following specific incubation with various concentrations of CPNs. Protoplasts were cultured for various times between 0 and 48 h following treatment with the following CPN concentrations: 5, 10, 25, 50, 100, 250 and 500 μM. The percentage of viable protoplasts was determined using propidium iodide staining at 0, 2,5,8,16,24 and 48 h. The data were expressed as the average % viability at each time point for log molar concentration of CPNs taken from three independent experiments.
Figure 4
Figure 4
CPNs deliver siGLO Red small RNAs to protoplasts. Bright field and epifluorescence images of protoplasts treated with: (A, B, C) 25 μM CPNs and 200 nM siGLO Red small RNAs (red); (D, E) only 200 nM siGLO Red small RNAs; (F, G) untreated protoplasts (negative controls). (E) Image shows no uptake of small RNAs in the absence of CPNs. (G) Image shows no green fluorescence, as expected. Experiments were repeated 2-3 times. Scale bars equal 20 μm.
Figure 5
Figure 5
Presence of CPN and siGLO Red small RNAs in protoplasts. (A) Dot plots of BY-2 protoplasts cultured with medium only, 200 nM siGLO Red, 10 μM CPNs, 10 μM CPNs + 200 nM siGLO Red, 25 μM CPNs, or 25 μM CPNs+200 nM siGLO Red. CPN fluorescence is detected with FITC filter (x axis) and siGLO Red fluorescence (y axis) is detected with PE filter in protoplasts cultured for 24 h. Each dot represents a single event with emissions frequency that is the combination of the fluorophores. The gated population in the lower left quadrant represents the majority of nonfluorescent cells. The upper right quadrant represents the majority of events that contain both green and red fluorescence due to CPNs and siGLO Red small RNAs. The upper left quadrant represent events that are positive only for siGLO Red small RNAs and the lower right quadrant represent events that are positive for only CPNs. Highly fluorescent protoplasts are located furthest along the x- and y- axes. (B) Bar graph reports the average of 10 replicate experiments using FACs to record the number of green fluorescent events inside protoplasts, as an indication of the internalization of CPNs (lower right quadrant of dot plots). Samples were treated with 0, 10, or 25 μM CPNs and then incubated for 2 and 24 h. Between 18-37% of protoplasts produce positive events via cytometric analyses. (C) Bar graph reports the average and stand deviations of 10 replicate experiments, recording the number of events reporting internalization of both CPNs and siGLO Red (upper right quadrant of the dot plots). Between 27 and 42% of recorded events are positive for both CPNs and siGLO Red RNAs when they are co-delivered to protoplasts.
Figure 6
Figure 6
CPN delivery of CesA-1 siRNAs suppress cell wall regeneration. (A) Protoplasts were harvested and immediately stained with calcofluor white (T = 0 h) to verify complete digestion and elimination of cell walls. Image shows no calcofluor fluorescence. (B) Protoplasts at 72 h treated with 10 μM CPNs and 200 nM NtCesA-1 siRNAs show few faint patches of blue fluorescence at the plasma membrane. (C) Untreated protoplasts at 72 h show significant deposition of cellulose at the cell surface. Experiments were repeated five times. Scale bars represent 10 μm. (D) The average percent of protoplasts from two experiments that showed calcofluor staining at 0, 24, 48, and 72 h following treatment with CPNs and NtCesA-1 siRNAs. (E) Propidium iodide was used to determine the percent viable protoplasts at 0, 24, 48, and 72 h following treatment with CPNs and NtCesA-1 siRNAs. Averages were determined for three replicate experiments. (F) Ethidium bromide- stained 1% agarose gels containing semi quantitative RT-PCR products detecting NtCesA-1 or ubiquitin (Ubi) gene expression. The treatments with siRNAs and CPNs are indicated above each panel and the numbers of PCR cycles from 30-45 are indicated below each lane. Lane "L" indicates DNA ladder at the bottom of the gel and size (bp) markers are indicated on the left. As a control, semi-quantitative PCR shows ubiquitin gene expression.
Figure 7
Figure 7
Fabrication of compounds 1, 2, and 3.

References

    1. Carrington JC. RNA silencing. Moving targets. Nature. 2000;408(6809):150–151. doi: 10.1038/35041662. - DOI - PubMed
    1. Baulcombe D. RNA silencing. Trends Biochem Sci. 2005;30(6):290–293. doi: 10.1016/j.tibs.2005.04.012. - DOI - PubMed
    1. Yang Z, Ebright YW, Yu B, Chen X. HEN1 recognizes 21-24 nt small RNA duplexes and deposits a methyl group onto the 2' OH of the 3' terminal nucleotide. Nucleic Acids Res. 2006;34(2):667–675. doi: 10.1093/nar/gkj474. - DOI - PMC - PubMed
    1. Dunoyer P, Lecellier CH, Parizotto EA, Himber C, Voinnet O. Probing the microRNA and small interfering RNA pathways with virus-encoded suppressors of RNA silencing. Plant Cell. 2004;16(5):1235–1250. doi: 10.1105/tpc.020719. - DOI - PMC - PubMed
    1. Pfeffer S, Voinnet O. Viruses, microRNAs and cancer. Oncogene. 2006;25(46):6211–6219. doi: 10.1038/sj.onc.1209915. - DOI - PubMed

Publication types

MeSH terms

LinkOut - more resources