. 2011 Mar 4;286(9):7692-704.
doi: 10.1074/jbc.M110.183863. Epub 2010 Dec 30.

Pulmonary proteases in the cystic fibrosis lung induce interleukin 8 expression from bronchial epithelial cells via a heme/meprin/epidermal growth factor receptor/Toll-like receptor pathway

Affiliations

Pulmonary proteases in the cystic fibrosis lung induce interleukin 8 expression from bronchial epithelial cells via a heme/meprin/epidermal growth factor receptor/Toll-like receptor pathway

Sonya Cosgrove et al. J Biol Chem. .

Abstract

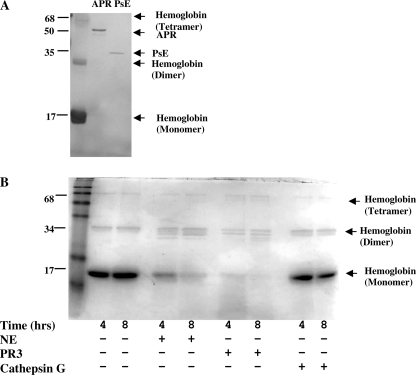
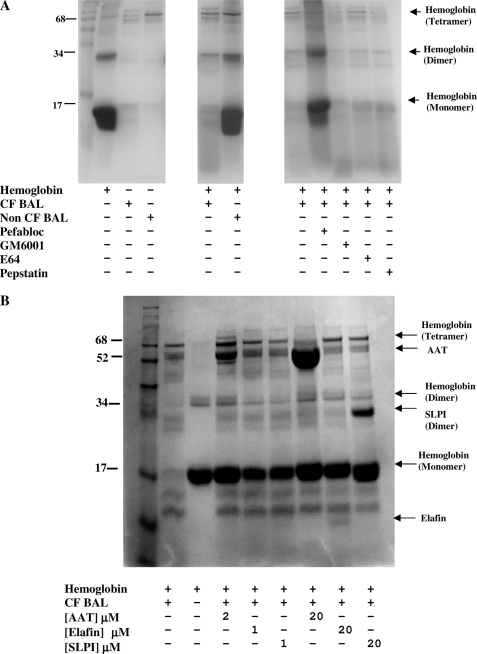
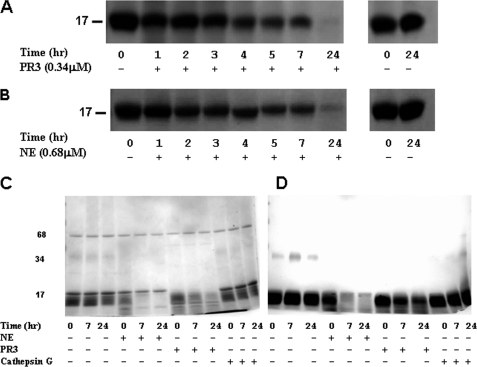
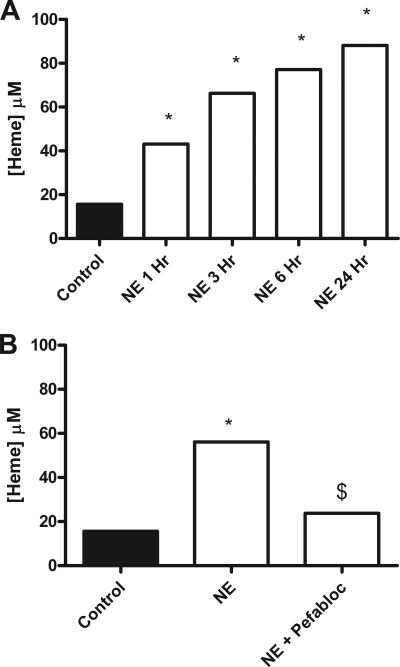
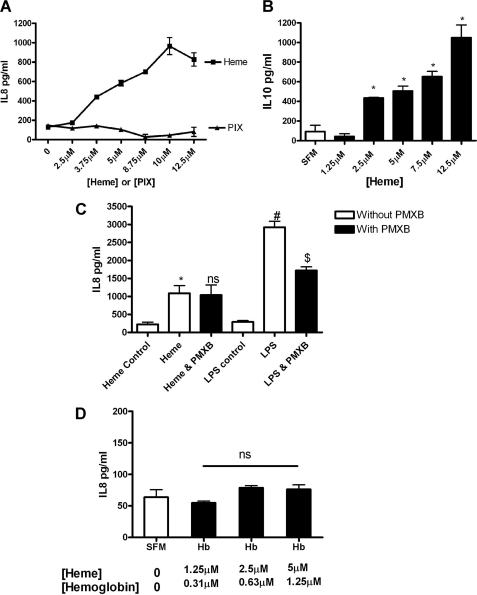
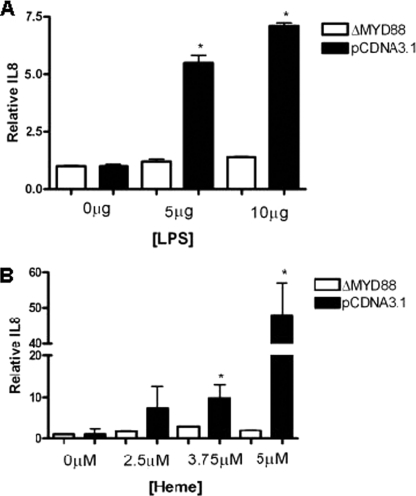
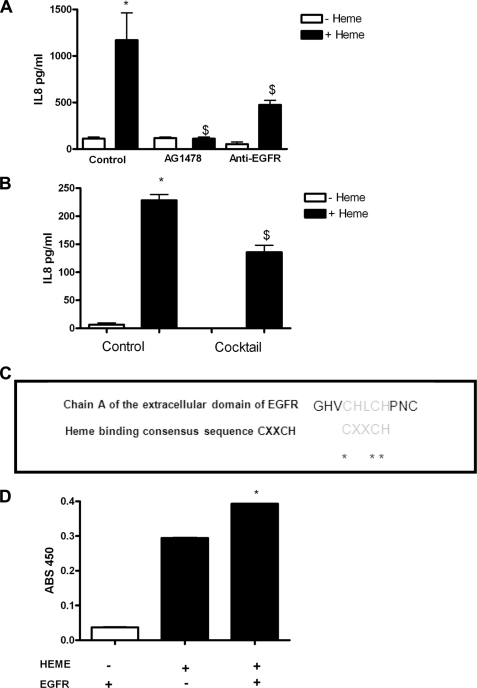
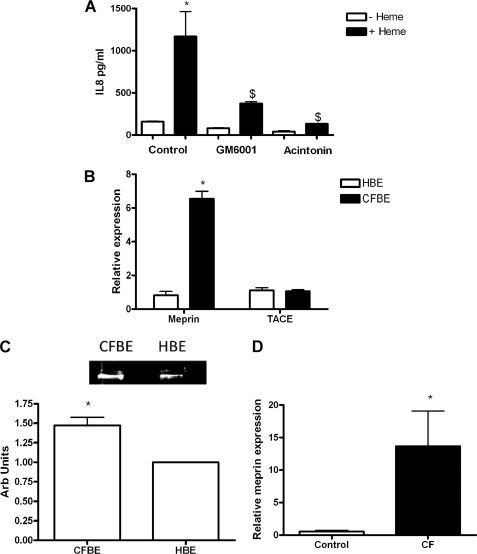
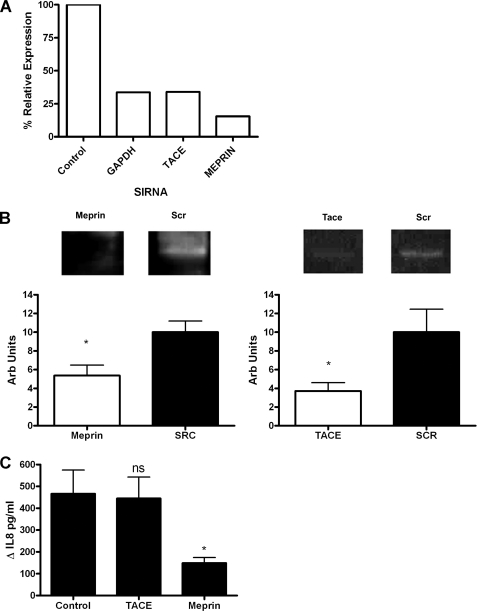
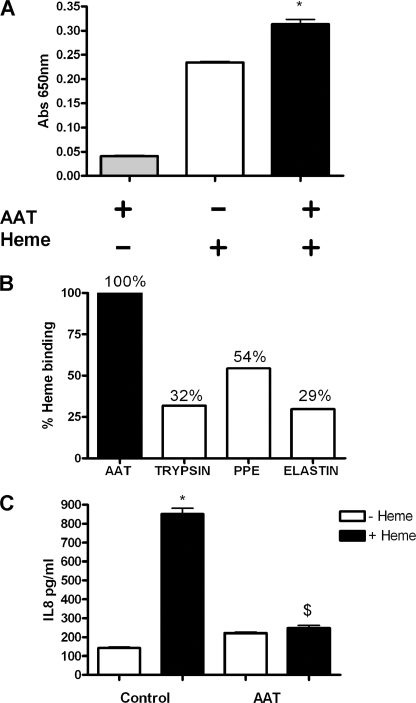
A high intrapulmonary protease burden is characteristic of cystic fibrosis (CF), and the resulting dysregulation of the protease/anti-protease balance has serious implications for inflammation in the CF lung. Because of this inflammation, micro-bleeds can occur releasing hemoglobin into the lung. The aim of this study was to investigate the effect of the protease-rich environment of the CF lung on human hemoglobin and to assess the proinflammatory effect of heme on CF bronchial epithelium. Here, we show that the Pseudomonas proteases (Pseudomonas elastase and alkaline protease) and the neutrophil proteases (neutrophil elastase (NE) and proteinase-3) are capable of almost complete degradation of hemoglobin in vitro but that NE is the predominant protease that cleaves hemoglobin in vivo in CF bronchoalveolar lavage fluid. One of the effects of this is the release of heme, and in this study we show that heme stimulates IL-8 and IL-10 protein production from ΔF508 CFBE41o(-) bronchial epithelial cells. In addition, heme-induced IL-8 expression utilizes a novel pathway involving meprin, EGF receptor, and MyD88. Meprin levels are elevated in CF cell lines and bronchial brushings, thus adding to the proinflammatory milieu. Interestingly, α(1)-antitrypsin, in addition to its ability to neutralize NE and protease-3, can also bind heme and neutralize heme-induced IL-8 from CFBE41o(-) cells. This study illustrates the proinflammatory effects of micro-bleeds in the CF lung, the process by which this occurs, and a potential therapeutic intervention.


Figures

FIGURE 1.
FIGURE 1.
Effect of Pseudomonas and neutrophil proteases on hemoglobin. Representative polyacrylamide gels were stained with Coomassie Brilliant Blue (R-250) of hemoglobin degradation by alkaline protease (1.6 μm) and Pseudomonas elastase (2.6 μm) after 24 h at 37 °C (n = 3) (A), and the effect of neutrophil proteases (1 μm) elastase (NE), protease-3, and cathepsin G on hemoglobin was at 37 °C (n = 2) (B).
FIGURE 2.
FIGURE 2.
Effect of CF BAL on cleavage of hemoglobin. A, hemoglobin (1.2 mg/ml) was incubated with CF and non-CF BAL (standardized by protein concentration) for 48 h at 37 °C in the presence and absence of protease inhibitors Pefabloc (10 mm), GM6001 (0.1 mm), E64 (2.8 mm), or pepstatin A (3 mm) (n = 2). B, hemoglobin (0.9 mg/ml) was incubated in the presence of CF BAL (1st lane), in the absence of CF BAL (2nd lane), in the presence of physiological concentrations of endogenous protease inhibitors AAT, elafin, or SLPI (2, 1, and 1 μm) (3rd to 5th lanes) and excess endogenous protease inhibitors AAT, elafin, or SLPI (20 μm) (6th to 8th lanes) for 24 h at 37 °C (n = 3).
FIGURE 3.
FIGURE 3.
Differential cleavage patterns of hemoglobin by the neutrophil proteases NE and PR3. Representative polyacrylamide gels stained with Coomassie Brilliant Blue (R-250) of hemoglobin (1 mg/ml) incubated with PR3 (0.34 μm) (A) and NE (0.68 μm) (B) at 37 °C. At the specified times, samples were removed; Pefabloc (4 mm) was added and stored at −20 °C before electrophoresis. C, polyacrylamide gels stained with Coomassie Brilliant Blue (R-250); D, polyacrylamide gels stained with TMB of hemoglobin (3 mg/ml) incubated with NE (0.3 μm) or PR3 (0.03 μm) or cathepsin G (0.17 μm) for 0 (sample taken ∼2 min after protease addition), 7m and 24 h. Data shown are representative of two experiments.
FIGURE 4.
FIGURE 4.
Effect of NE on heme release from hemoglobin-agarose in the presence and absence of Pefabloc. A, hemoglobin-agarose (6 mg/ml) was incubated with NE at 37 °C with samples removed at the specified times, and Pefabloc (2 mm) was added. Heme release (0–24 h) in the supernatants was measured by heme spectrophotometric assay. B, NE (1 μm) was incubated with and without Pefabloc (1 h, room temperature, 2 mm) and then hemoglobin-agarose (6 mg/ml) (37 °C, 24 h) was added. Heme release into the supernatants was measured by heme spectrophotometric assay. All heme assay experiments were performed in triplicate, and the data are represented as mean ± S.E. and are representative of two (A) and three (B) experiments. A, *, p ≤ 0.05, NE versus control; B, *, p ≤ 0.05, NE versus control; $, p ≤ 0.05, NE versus NE + Pefabloc.
FIGURE 5.
FIGURE 5.
Effect of heme on IL-8 and IL-10 expression by CFBE41o cells. CFBE41o cells (1 × 10⁵) were treated with heme (0–12.5 μm) or PIX (0–12.5 μm) for 24 h and IL-8 (A), and IL-10 secretion into supernatant was measured by ELISA (B). C–D, IL-8 levels were quantified by ELISA in response to heme or heme + PMXB (50 μg) or LPS (50 μg) or LPS + polymyxin B (C) or hemoglobin (0–5 μm, [heme]) (D). ELISAs were preformed in triplicate; the data are represented as mean ± S.E. and are representative of three (A), one (B), three (C), and three (D), experiments. *, p ≤ 0.05, heme versus SFM control; B, *, p ≤ 0.05, heme versus SFM control; C, *, p ≤ 0.05, heme versus heme control; #, p ≤ 0.05, LPS versus LPS control; $, p ≤ 0.05, LPS versus LPS and PMXB (D); p = not significant (ns), hemoglobin versus SFM control.
FIGURE 6.
FIGURE 6.
ΔMyD88 inhibits heme-induced IL-8 expression. CFBE41o cells (1 × 10⁵) were co-transfected for 24 h with pRLSV40 and an empty plasmid pCDNA3.1 or a vector expressing ΔMyD88 and then stimulated for 24 h with LPS (5–10 μg/ml) (A) or heme (2.5–5 μm) (B). Cells were lysed, and transfection efficiency was quantified by luminometry. IL-8 secretion in supernatants was measured by ELISA, and relative IL-8 levels in supernatants are shown. All ELISA experiments were performed in triplicate; the data are represented as mean ± S.E. Data shown are representative of three experiments. A, *, p ≤ 0.05, ΔMyd88 versus pCDNA3.1 with 5 μg or 10 μg of LPS; B, *, p ≤ 0.05, ΔMyD88 versus pCDNA3.1 with 3.75 or 5 μm heme.
FIGURE 7.
FIGURE 7.
Heme-induced IL-8 occurs via activation of EGFR by EGFR ligands in CFBE41o cells. CFBE41o cells (1 × 10⁵) were treated with media or DMSO- (control), AG1478- (500 nm), or an EGFR-neutralizing antibody (2 μg,) for 1 h prior to treatment with heme (5 μm, 24 h) (A). IL-8 levels in supernatants were quantified by ELISA. CFBE41o cells (1 × 10⁵) were incubated with anti-TGFα- (10 μg), anti-EGF- (16 μg), anti-heparin-binding epidermal growth factor-like growth factor- (5 μg), anti-amphiregulin- (2 μg), anti-epiregulin- (3 μg), and anti-betacellulin (0.16 μg)-neutralizing antibodies (mixture, 1 h) and then stimulated with heme (8.75 μm, 24 h) (B). IL-8 levels in supernatants were quantified by ELISA. All IL-8 ELISA experiments were performed in triplicate; the data are represented as mean ± S.E. IL-8 ELISA data shown are representative of three experiments. C, alignment of chain A of an extracellular EGFR domain (UniProtKB/Swiss-Prot code P00533 (EGFR_HUMAN)) with the heme-binding motif. The asterisks indicate conserved residues within the motif. D, soluble human EGFR recombinant fragment containing the heme-binding motif binds heme. 20 μg/ml soluble human EGFR recombinant fragment was immobilized on a 96-well plate overnight before treatment with heme (50 μm). EGFR-bound heme was detected spectrophotometrically by direct heme reaction with TMB ultrasensitive substrate (100 μl/well). EGFR ELISA experiments were performed in duplicate; the data are represented as mean ± S.E. EGFR ELISA data shown are representative of two experiments. A, *, p ≤ 0.05, control versus heme; $, p ≤ 0.05, AG1478 + heme and anti-EGFR + heme versus control + heme; B, *, p ≤ 0.05, control versus heme; $, p ≤ 0.05, mixture + heme versus control + heme; D, *, p ≤ 0.05, heme or EGFR alone versus heme and EGFR.
FIGURE 8.
FIGURE 8.
Meprin and TACE RNA expression in vitro and in vivo and in vitro meprin protein expression relative to GAPDH. A, CFBE41o cells (1 × 10⁵) were incubated with and without GM6001 (10 μm) or acintonin (100 μm) for 1 h prior to treatment with heme (8.75 μm, 24 h). IL-8 levels in supernatants were quantified by ELISA. B, relative meprin and TACE expression in CFBE41o and 16HBE14o cell lines (n = 3) was measured by qRT-PCR. C, meprin protein was analyzed by Western blot (n = 3) using anti-meprin and anti-GAPDH antibodies in CFBE41o and 16HBE14o cell lines. Representative densitometry of meprin relative to GAPDH. CFBE, cystic fibrosis bronchial epithelial cells; HBE, human bronchial epithelial cells. D, relative meprin expression in CF versus non-CF bronchial brushings (n = 4) was measured by qRT-PCR. All qRT-PCR experiments were performed in triplicate and included no-template controls; the data are represented as mean ± S.E. A, *, p ≤ 0.05, control versus heme; $, p ≤ 0.05, GM6001 + heme and acintonin + heme versus control + heme; B, *, p ≤ 0.05, meprin relative expression in CFBE41o versus 16HBE14o cell lines; D, *, p ≤ 0.05, meprin relative expression in CF versus non-CF bronchial brushings.
FIGURE 9.
FIGURE 9.
Meprin mediates heme-induced IL-8 expression in CFBE41o. A, CFBE41o cells (0.8 × 10⁵) were untransfected (control) or transfected with GAPDH, meprin α, or TACE (50 nm) siRNAs, and knockdown was quantified by qRT-PCR comparing siRNA target gene to β-actin expression, % relative expression is shown. B, meprin and TACE protein knockdown was analyzed by Western blot using anti-meprin, anti-TACE, and anti-GAPDH antibodies in CFBE41o cell lines that had been transfected with meprin and TACE siRNA. Representative densitometry of meprin and TACE knockdown relative to GAPDH is shown (n = 5 and 6, respectively). The data are represented as mean ± S.E. *, p ≤ 0.05, meprin versus control and TACE versus control. These cells were stimulated with heme (7.5 μm, 24 h), and IL-8 levels in supernatants were quantified by ELISA (C). The graph shows ΔIL-8 (pg/ml) versus untreated cells. All ELISA and qRT-PCR experiments were preformed in triplicate; the data are represented as mean ± S.E. Data shown are representative of three experiments. *, p ≤ 0.05, meprin versus control.
FIGURE 10.
FIGURE 10.
AAT binds heme and neutralizes heme-induced IL-8 secretion by CFBE41o. A, 20 μg/ml of AAT was immobilized on a 96-well plate overnight before treatment with heme (50 μm). AAT-bound heme was detected spectrophotometrically by direct heme reaction with TMB-ultrasensitive substrate (100 μl/well). B, AAT (20 μg/ml), trypsin (20 μg/ml), PPE (20 μg/ml), and elastin (20 μg/ml) were immobilized on a 96-well plate overnight before treatment with heme (50 μm). Heme binding was quantified to show % binding of heme to AAT, trypsin, PPE, and elastin. C, CFBE41o cells (1 × 10⁵) were treated with heme (8.75 μm, 24 h) in the presence and absence of AAT (20 μm). IL-8 levels in supernatants were quantified by ELISA. All ELISA experiments were performed in triplicate; the data are represented as mean ± S.E. Data shown are representative of three experiments. A, *, p ≤ 0.05, AAT + heme versus AAT control and heme control; C, *, p ≤ 0.05, control versus heme; $, p ≤ 0.05, AAT + heme versus control + heme.

References

    1. Rees D. D., Brain J. D., Wohl M. E., Humes J. L., Mumford R. A. (1997) J. Pharmacol. Exp. Ther. 283, 1201–1206 - PubMed
    1. Geraghty P., Rogan M. P., Greene C. M., Boxio R. M., Poiriert T., O'Mahony M., Belaaouaj A., O'Neill S. J., Taggart C. C., McElvaney N. G. (2007) J. Immunol. 178, 5871–5878 - PubMed
    1. Bergin D. A., Greene C. M., Sterchi E. E., Kenna C., Geraghty P., Belaaouaj A., Belaaouaj A., Taggart C. C., O'Neill S. J., McElvaney N. G. (2008) J. Biol. Chem. 283, 31736–31744 - PubMed
    1. Nakamura H., Yoshimura K., McElvaney N. G., Crystal R. G. (1992) J. Clin. Invest. 89, 1478–1484 - PMC - PubMed
    1. Walsh D. E., Greene C. M., Carroll T. P., Taggart C. C., Gallagher P. M., O'Neill S. J., McElvaney N. G. (2001) J. Biol. Chem. 276, 35494–35499 - PubMed

Publication types

MeSH terms